Mean State
Download Data |
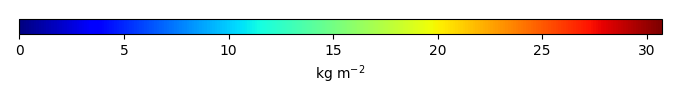
Period Mean (original grids) ceam [Pg] |
Period Mean (original grids) [Pg] |
Period Mean (original grids) tena [Pg] |
Period Mean (original grids) bona [Pg] |
Model Period Mean (intersection) tena [Pg] |
Model Period Mean (intersection) [Pg] |
Model Period Mean (intersection) ceam [Pg] |
Model Period Mean (intersection) bona [Pg] |
Model Period Mean (complement) ceam [Pg] |
Model Period Mean (complement) bona [Pg] |
Model Period Mean (complement) [Pg] |
Model Period Mean (complement) tena [Pg] |
Benchmark Period Mean (intersection) bona [Pg] |
Benchmark Period Mean (intersection) tena [Pg] |
Benchmark Period Mean (intersection) [Pg] |
Benchmark Period Mean (intersection) ceam [Pg] |
Benchmark Period Mean (complement) [Pg] |
Benchmark Period Mean (complement) tena [Pg] |
Benchmark Period Mean (complement) ceam [Pg] |
Benchmark Period Mean (complement) bona [Pg] |
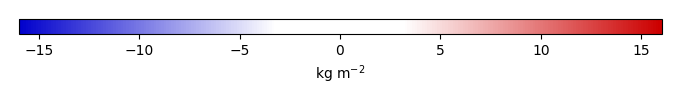
Bias [kg m-2] |
Bias tena [kg m-2] |
Bias bona [kg m-2] |
Bias ceam [kg m-2] |
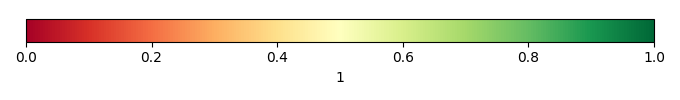
Bias Score [1] |
Bias Score bona [1] |
Bias Score ceam [1] |
Bias Score tena [1] |
Spatial Distribution Score bona [1] |
Spatial Distribution Score ceam [1] |
Spatial Distribution Score tena [1] |
Spatial Distribution Score [1] |
Overall Score [1] |
|||
|---|---|---|---|---|---|---|---|---|---|---|---|---|---|---|---|---|---|---|---|---|---|---|---|---|---|---|---|---|---|---|---|---|---|---|---|---|
| Benchmark | [-] | 0.878 | 30.1 | 26.5 | 2.76 | |||||||||||||||||||||||||||||||
| 20191109_storageparms | [-] | 9.84 | 515. | 29.4 | 25.9 | 21.8 | 26.6 | 1.37 | 3.45 | 8.47 | 22.5 | 489. | 7.65 | 2.59 | 26.2 | 29.6 | 0.825 | 0.548 | 0.322 | 0.0537 | 0.170 | -0.341 | -0.622 | 0.668 | 1.20 | 0.67 | 0.56 | 0.66 | 0.68 | 0.47 | 0.86 | 0.82 | 0.79 | 0.73 | ||
| ELM_v1default | [-] | 11.4 | 578. | 33.7 | 29.6 | 25.7 | 31.7 | 1.72 | 4.30 | 9.68 | 25.3 | 546. | 8.00 | 2.59 | 26.2 | 29.6 | 0.825 | 0.548 | 0.322 | 0.0537 | 0.170 | 0.240 | -0.0680 | 1.33 | 1.98 | 0.66 | 0.51 | 0.64 | 0.68 | 0.48 | 0.86 | 0.80 | 0.77 | 0.72 |
Temporally integrated period mean