Mean State
Download Data |
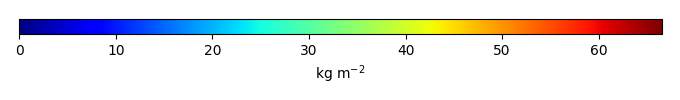
Period Mean (original grids) ceas [Pg] |
Period Mean (original grids) boas [Pg] |
Period Mean (original grids) [Pg] |
Period Mean (original grids) tena [Pg] |
Period Mean (original grids) bona [Pg] |
Period Mean (original grids) euro [Pg] |
Model Period Mean (intersection) tena [Pg] |
Model Period Mean (intersection) boas [Pg] |
Model Period Mean (intersection) [Pg] |
Model Period Mean (intersection) ceas [Pg] |
Model Period Mean (intersection) bona [Pg] |
Model Period Mean (intersection) euro [Pg] |
Model Period Mean (complement) ceas [Pg] |
Model Period Mean (complement) euro [Pg] |
Model Period Mean (complement) bona [Pg] |
Model Period Mean (complement) [Pg] |
Model Period Mean (complement) boas [Pg] |
Model Period Mean (complement) tena [Pg] |
Benchmark Period Mean (intersection) euro [Pg] |
Benchmark Period Mean (intersection) bona [Pg] |
Benchmark Period Mean (intersection) boas [Pg] |
Benchmark Period Mean (intersection) tena [Pg] |
Benchmark Period Mean (intersection) [Pg] |
Benchmark Period Mean (intersection) ceas [Pg] |
Benchmark Period Mean (complement) [Pg] |
Benchmark Period Mean (complement) tena [Pg] |
Benchmark Period Mean (complement) ceas [Pg] |
Benchmark Period Mean (complement) bona [Pg] |
Benchmark Period Mean (complement) boas [Pg] |
Benchmark Period Mean (complement) euro [Pg] |
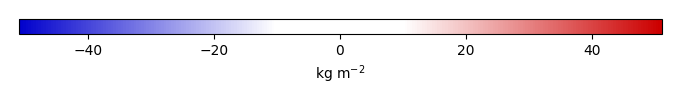
Bias [kg m-2] |
Bias tena [kg m-2] |
Bias euro [kg m-2] |
Bias bona [kg m-2] |
Bias boas [kg m-2] |
Bias ceas [kg m-2] |
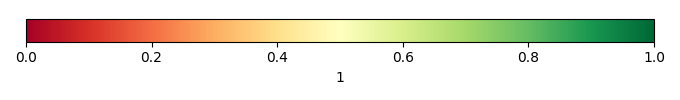
Bias Score euro [1] |
Bias Score [1] |
Bias Score ceas [1] |
Bias Score bona [1] |
Bias Score tena [1] |
Bias Score boas [1] |
Spatial Distribution Score ceas [1] |
Spatial Distribution Score tena [1] |
Spatial Distribution Score bona [1] |
Spatial Distribution Score [1] |
Spatial Distribution Score boas [1] |
Spatial Distribution Score euro [1] |
Overall Score [1] |
|||
|---|---|---|---|---|---|---|---|---|---|---|---|---|---|---|---|---|---|---|---|---|---|---|---|---|---|---|---|---|---|---|---|---|---|---|---|---|---|---|---|---|---|---|---|---|---|---|---|---|---|---|---|---|
| Benchmark | [-] | 44.9 | 222. | 475. | 0.539 | 160. | 5.18 | |||||||||||||||||||||||||||||||||||||||||||||
| 20191109_storageparms | [-] | 146. | 245. | 1.14e+03 | 81.9 | 146. | 61.5 | 0.960 | 199. | 396. | 44.1 | 121. | 3.58 | 102. | 57.9 | 24.9 | 749. | 46.7 | 81.0 | 5.18 | 154. | 220. | 0.539 | 465. | 44.8 | 10.5 | 0.00 | 0.137 | 5.76 | 2.31 | 0.00 | -3.11 | 4.50 | -6.09 | -4.26 | -2.65 | -0.254 | 0.60 | 0.61 | 0.67 | 0.52 | 0.48 | 0.66 | 0.92 | 0.91 | 0.76 | 0.87 | 0.90 | 0.58 | 0.74 | ||
| ELM_v1default | [-] | 146. | 240. | 1.13e+03 | 81.6 | 144. | 61.7 | 0.959 | 193. | 388. | 44.0 | 119. | 3.62 | 102. | 58.1 | 24.8 | 745. | 46.6 | 80.7 | 5.18 | 154. | 220. | 0.539 | 465. | 44.8 | 10.5 | 0.00 | 0.137 | 5.76 | 2.31 | 0.00 | -3.47 | 4.49 | -5.94 | -4.43 | -3.36 | -0.303 | 0.60 | 0.61 | 0.67 | 0.52 | 0.48 | 0.66 | 0.92 | 0.91 | 0.75 | 0.86 | 0.90 | 0.59 | 0.73 |
Temporally integrated period mean