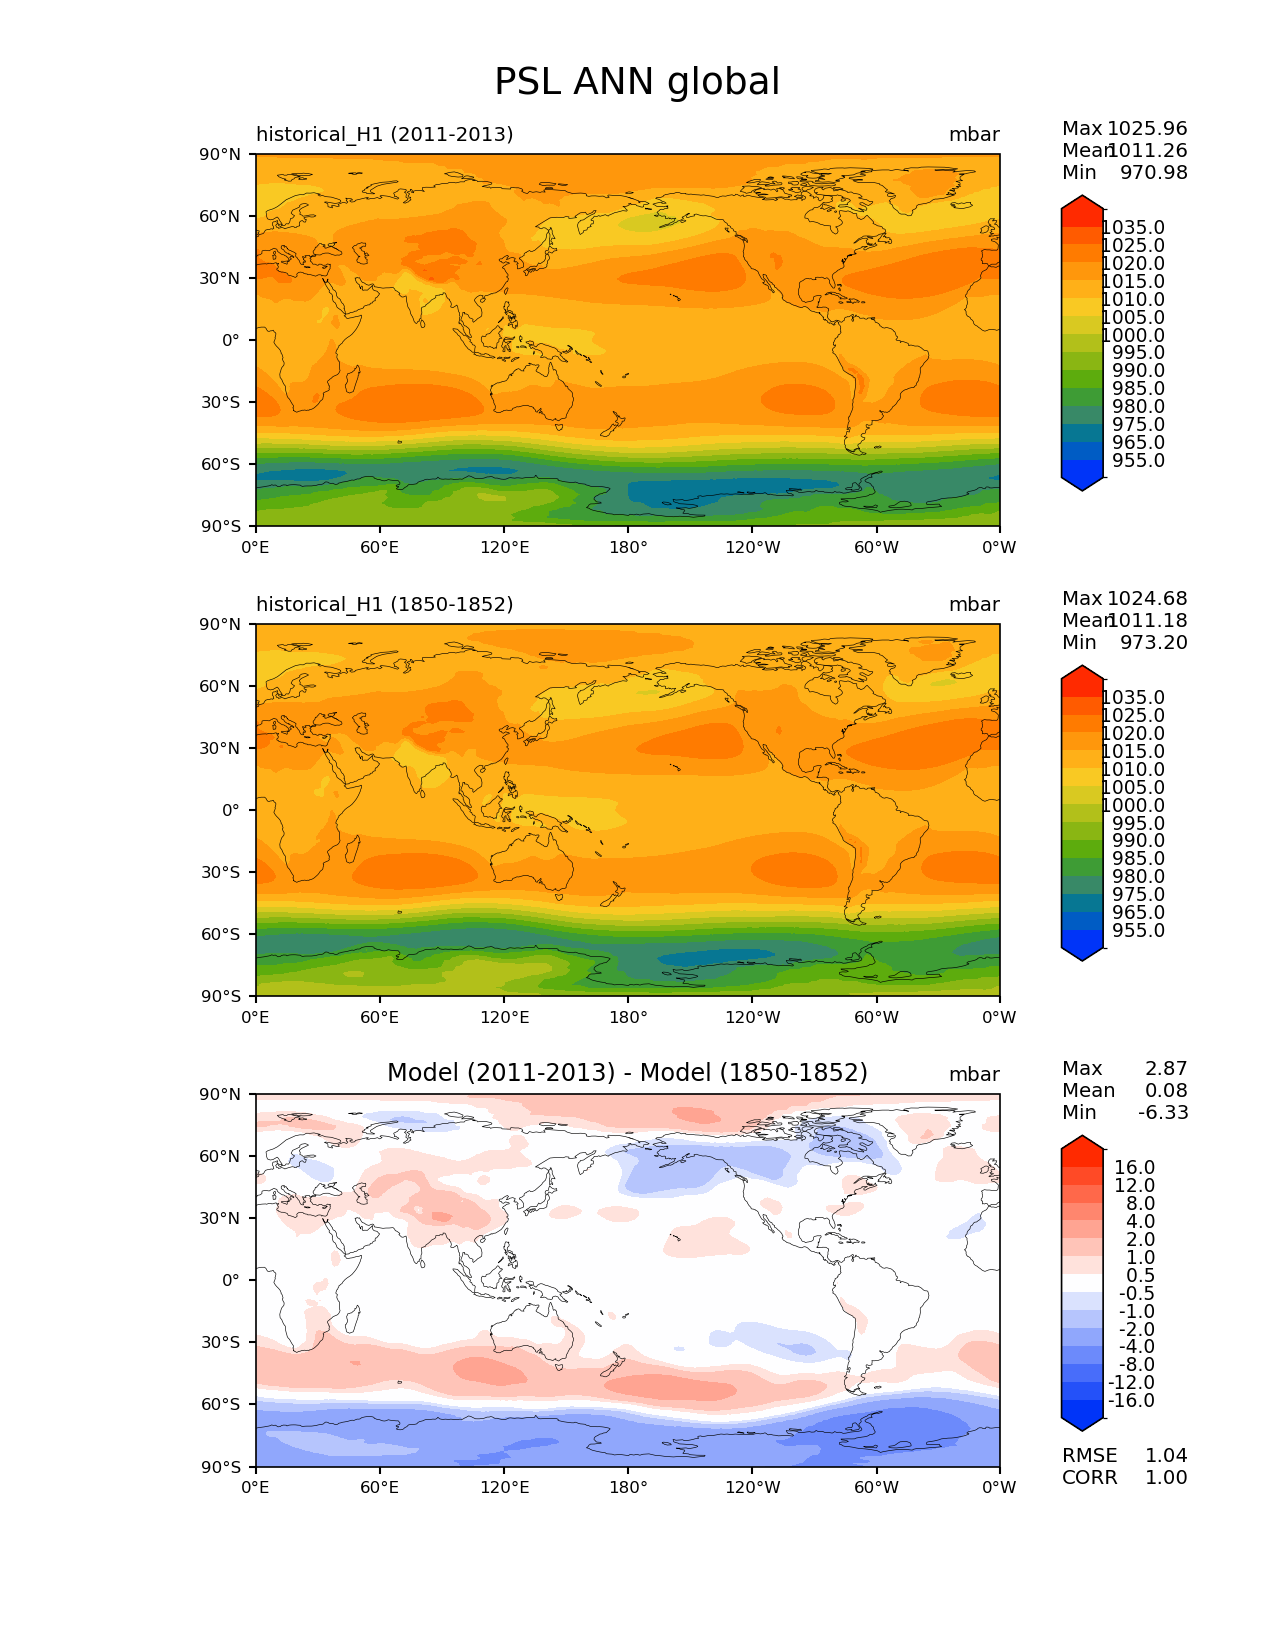
| Use this command to recreate this image: | e3sm_diags lat_lon --no_viewer --reference_data_path '/global/cfs/cdirs/e3sm/e3sm_diags/test_model_data_for_acme_diags/time-series/E3SM_v1' --test_data_path '/global/cfs/cdirs/e3sm/e3sm_diags/test_model_data_for_acme_diags/time-series/E3SM_v1' --results_dir '/global/cfs/cdirs/e3sm/www/vo13/examples/refactor-655-zonal-mean-2d' --case_id 'model_vs_model' --ref_timeseries_input --test_timeseries_input --run_type 'model_vs_model' --sets 'lat_lon' --variables 'PSL' --seasons 'ANN' --regions 'global' --regrid_tool 'esmf' --regrid_method 'conservative' --multiprocessing --num_workers '24' --main_title 'PSL ANN global' --backend 'cartopy' --output_format 'png' --canvas_size_w '1212' --canvas_size_h '1628' --figsize '8.5' '11.0' --dpi '150' --arrows --contour_levels '955' '965' '975' '980' '985' '990' '995' '1000' '1005' '1010' '1015' '1020' '1025' '1035' --short_test_name 'historical_H1' --test_colormap 'cet_rainbow.rgb' --reference_colormap 'cet_rainbow.rgb' --diff_title 'Model (2011-2013) - Model (1850-1852)' --diff_colormap 'diverging_bwr.rgb' --diff_levels '-16' '-12' '-8' '-4' '-2' '-1' '-0.5' '0.5' '1' '2' '4' '8' '12' '16' --granulate 'variables' 'seasons' 'plevs' 'regions' --selectors 'sets' 'seasons' --test_start_yr 2011 --test_end_yr 2013 --ref_start_yr 1850 --ref_end_yr 1852 |