Mean State
Download Data |
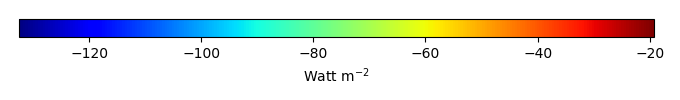
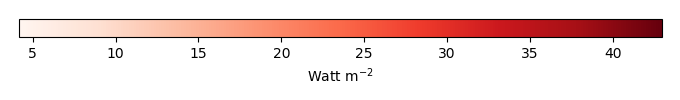
Period Mean (original grids) [Watt m-2] |
Model Period Mean (intersection) [Watt m-2] |
Model Period Mean (complement) [Watt m-2] |
Benchmark Period Mean (intersection) [Watt m-2] |
Benchmark Period Mean (complement) [Watt m-2] |
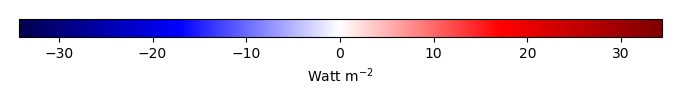
Bias [Watt m-2] |
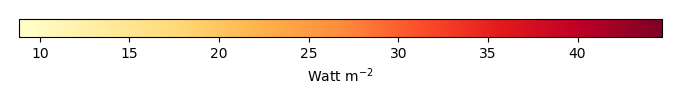
RMSE [Watt m-2] |
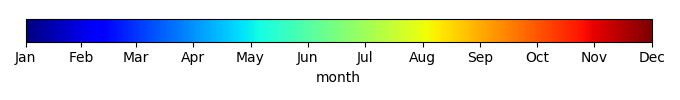
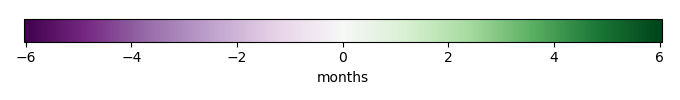
Phase Shift [months] |
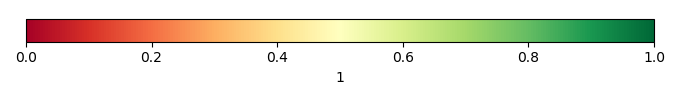
Bias Score [1] |
RMSE Score [1] |
Seasonal Cycle Score [1] |
Spatial Distribution Score [1] |
Interannual Variability Score [1] |
Overall Score [1] |
|||
|---|---|---|---|---|---|---|---|---|---|---|---|---|---|---|---|---|---|
| Benchmark | [-] | -84.2 | |||||||||||||||
| CTC_CBGC_20180719 | [-] | -87.2 | -87.4 | 0.00 | -95.8 | -54.3 | 8.43 | 27.3 | 0.906 | 0.54 | 0.33 | 0.88 | 0.77 | 0.74 | 0.60 | ||
| ECA_CBGC_20180729 | [-] | -87.5 | -87.6 | 0.00 | -95.8 | -54.3 | 8.27 | 27.5 | 1.01 | 0.52 | 0.33 | 0.87 | 0.71 | 0.73 | 0.58 |
Download Data |
Period Mean (original grids) [Watt m-2] |
Model Period Mean (intersection) [Watt m-2] |
Model Period Mean (complement) [Watt m-2] |
Benchmark Period Mean (intersection) [Watt m-2] |
Benchmark Period Mean (complement) [Watt m-2] |
Bias [Watt m-2] |
RMSE [Watt m-2] |
Phase Shift [months] |
Bias Score [1] |
RMSE Score [1] |
Seasonal Cycle Score [1] |
Spatial Distribution Score [1] |
Interannual Variability Score [1] |
Overall Score [1] |
|||
|---|---|---|---|---|---|---|---|---|---|---|---|---|---|---|---|---|---|
| Benchmark | [-] | -38.3 | |||||||||||||||
| CTC_CBGC_20180719 | [-] | -34.0 | -34.0 | 0.00 | -37.9 | -47.1 | 3.92 | 14.3 | 0.998 | 0.76 | 0.46 | 0.87 | 0.99 | 0.78 | 0.72 | ||
| ECA_CBGC_20180729 | [-] | -36.1 | -36.1 | 0.00 | -37.9 | -47.1 | 1.84 | 14.8 | 1.03 | 0.71 | 0.45 | 0.86 | 0.84 | 0.78 | 0.68 |
Download Data |
Period Mean (original grids) [Watt m-2] |
Model Period Mean (intersection) [Watt m-2] |
Model Period Mean (complement) [Watt m-2] |
Benchmark Period Mean (intersection) [Watt m-2] |
Benchmark Period Mean (complement) [Watt m-2] |
Bias [Watt m-2] |
RMSE [Watt m-2] |
Phase Shift [months] |
Bias Score [1] |
RMSE Score [1] |
Seasonal Cycle Score [1] |
Spatial Distribution Score [1] |
Interannual Variability Score [1] |
Overall Score [1] |
|||
|---|---|---|---|---|---|---|---|---|---|---|---|---|---|---|---|---|---|
| Benchmark | [-] | -36.4 | |||||||||||||||
| CTC_CBGC_20180719 | [-] | -33.7 | -33.8 | 0.00 | -36.6 | -35.7 | 2.91 | 15.7 | 1.95 | 0.69 | 0.38 | 0.70 | 0.96 | 0.72 | 0.64 | ||
| ECA_CBGC_20180729 | [-] | -35.2 | -35.2 | 0.00 | -36.6 | -35.7 | 1.48 | 15.9 | 1.97 | 0.67 | 0.39 | 0.70 | 0.91 | 0.75 | 0.63 |
Download Data |
Period Mean (original grids) [Watt m-2] |
Model Period Mean (intersection) [Watt m-2] |
Model Period Mean (complement) [Watt m-2] |
Benchmark Period Mean (intersection) [Watt m-2] |
Benchmark Period Mean (complement) [Watt m-2] |
Bias [Watt m-2] |
RMSE [Watt m-2] |
Phase Shift [months] |
Bias Score [1] |
RMSE Score [1] |
Seasonal Cycle Score [1] |
Spatial Distribution Score [1] |
Interannual Variability Score [1] |
Overall Score [1] |
|||
|---|---|---|---|---|---|---|---|---|---|---|---|---|---|---|---|---|---|
| Benchmark | [-] | -62.4 | |||||||||||||||
| CTC_CBGC_20180719 | [-] | -76.4 | -76.3 | 0.00 | -69.1 | -53.9 | -7.30 | 25.8 | 2.10 | 0.38 | 0.27 | 0.70 | 0.73 | 0.64 | 0.50 | ||
| ECA_CBGC_20180729 | [-] | -78.7 | -78.5 | 0.00 | -69.1 | -53.9 | -9.46 | 25.3 | 1.79 | 0.39 | 0.26 | 0.73 | 0.78 | 0.66 | 0.52 |
Download Data |
Period Mean (original grids) [Watt m-2] |
Model Period Mean (intersection) [Watt m-2] |
Model Period Mean (complement) [Watt m-2] |
Benchmark Period Mean (intersection) [Watt m-2] |
Benchmark Period Mean (complement) [Watt m-2] |
Bias [Watt m-2] |
RMSE [Watt m-2] |
Phase Shift [months] |
Bias Score [1] |
RMSE Score [1] |
Seasonal Cycle Score [1] |
Spatial Distribution Score [1] |
Interannual Variability Score [1] |
Overall Score [1] |
|||
|---|---|---|---|---|---|---|---|---|---|---|---|---|---|---|---|---|---|
| Benchmark | [-] | -72.2 | |||||||||||||||
| CTC_CBGC_20180719 | [-] | -72.2 | -72.3 | 0.00 | -73.3 | -57.9 | 1.00 | 21.2 | 1.31 | 0.70 | 0.42 | 0.82 | 0.96 | 0.76 | 0.68 | ||
| ECA_CBGC_20180729 | [-] | -74.6 | -74.8 | 0.00 | -73.3 | -57.9 | -1.47 | 21.5 | 1.42 | 0.68 | 0.42 | 0.80 | 0.94 | 0.77 | 0.67 |
Download Data |
Period Mean (original grids) [Watt m-2] |
Model Period Mean (intersection) [Watt m-2] |
Model Period Mean (complement) [Watt m-2] |
Benchmark Period Mean (intersection) [Watt m-2] |
Benchmark Period Mean (complement) [Watt m-2] |
Bias [Watt m-2] |
RMSE [Watt m-2] |
Phase Shift [months] |
Bias Score [1] |
RMSE Score [1] |
Seasonal Cycle Score [1] |
Spatial Distribution Score [1] |
Interannual Variability Score [1] |
Overall Score [1] |
|||
|---|---|---|---|---|---|---|---|---|---|---|---|---|---|---|---|---|---|
| Benchmark | [-] | -46.3 | |||||||||||||||
| CTC_CBGC_20180719 | [-] | -38.9 | -38.9 | 0.00 | -46.1 | -47.0 | 7.16 | 12.6 | 1.87 | 0.32 | 0.22 | 0.72 | 0.98 | 0.66 | 0.52 | ||
| ECA_CBGC_20180729 | [-] | -47.6 | -47.7 | 0.00 | -46.1 | -47.0 | -1.65 | 13.9 | 1.78 | 0.33 | 0.20 | 0.72 | 0.58 | 0.58 | 0.43 |
Download Data |
Period Mean (original grids) [Watt m-2] |
Model Period Mean (intersection) [Watt m-2] |
Model Period Mean (complement) [Watt m-2] |
Benchmark Period Mean (intersection) [Watt m-2] |
Benchmark Period Mean (complement) [Watt m-2] |
Bias [Watt m-2] |
RMSE [Watt m-2] |
Phase Shift [months] |
Bias Score [1] |
RMSE Score [1] |
Seasonal Cycle Score [1] |
Spatial Distribution Score [1] |
Interannual Variability Score [1] |
Overall Score [1] |
|||
|---|---|---|---|---|---|---|---|---|---|---|---|---|---|---|---|---|---|
| Benchmark | [-] | -56.0 | |||||||||||||||
| CTC_CBGC_20180719 | [-] | -54.5 | -54.0 | 0.00 | -56.9 | -51.3 | 2.86 | 17.7 | 1.28 | 0.62 | 0.29 | 0.83 | 0.97 | 0.58 | 0.60 | ||
| ECA_CBGC_20180729 | [-] | -57.6 | -57.1 | 0.00 | -56.9 | -51.3 | -0.231 | 18.6 | 1.29 | 0.59 | 0.27 | 0.83 | 0.97 | 0.52 | 0.58 |
Download Data |
Period Mean (original grids) [Watt m-2] |
Model Period Mean (intersection) [Watt m-2] |
Model Period Mean (complement) [Watt m-2] |
Benchmark Period Mean (intersection) [Watt m-2] |
Benchmark Period Mean (complement) [Watt m-2] |
Bias [Watt m-2] |
RMSE [Watt m-2] |
Phase Shift [months] |
Bias Score [1] |
RMSE Score [1] |
Seasonal Cycle Score [1] |
Spatial Distribution Score [1] |
Interannual Variability Score [1] |
Overall Score [1] |
|||
|---|---|---|---|---|---|---|---|---|---|---|---|---|---|---|---|---|---|
| Benchmark | [-] | -52.6 | |||||||||||||||
| CTC_CBGC_20180719 | [-] | -69.6 | -63.2 | 0.00 | -63.0 | -46.2 | -0.189 | 20.7 | 1.51 | 0.56 | 0.36 | 0.78 | 0.97 | 0.72 | 0.63 | ||
| ECA_CBGC_20180729 | [-] | -72.3 | -65.4 | 0.00 | -63.0 | -46.2 | -2.39 | 20.9 | 1.48 | 0.54 | 0.36 | 0.78 | 0.97 | 0.71 | 0.62 |
Download Data |
Period Mean (original grids) [Watt m-2] |
Model Period Mean (intersection) [Watt m-2] |
Model Period Mean (complement) [Watt m-2] |
Benchmark Period Mean (intersection) [Watt m-2] |
Benchmark Period Mean (complement) [Watt m-2] |
Bias [Watt m-2] |
RMSE [Watt m-2] |
Phase Shift [months] |
Bias Score [1] |
RMSE Score [1] |
Seasonal Cycle Score [1] |
Spatial Distribution Score [1] |
Interannual Variability Score [1] |
Overall Score [1] |
|||
|---|---|---|---|---|---|---|---|---|---|---|---|---|---|---|---|---|---|
| Benchmark | [-] | -113. | |||||||||||||||
| CTC_CBGC_20180719 | [-] | -103. | -102. | 0.00 | -115. | -68.8 | 13.2 | 29.9 | 0.836 | 0.53 | 0.43 | 0.91 | 0.77 | 0.64 | 0.62 | ||
| ECA_CBGC_20180729 | [-] | -104. | -104. | 0.00 | -115. | -68.8 | 11.5 | 29.4 | 0.832 | 0.54 | 0.44 | 0.91 | 0.78 | 0.65 | 0.62 |
Download Data |
Period Mean (original grids) [Watt m-2] |
Model Period Mean (intersection) [Watt m-2] |
Model Period Mean (complement) [Watt m-2] |
Benchmark Period Mean (intersection) [Watt m-2] |
Benchmark Period Mean (complement) [Watt m-2] |
Bias [Watt m-2] |
RMSE [Watt m-2] |
Phase Shift [months] |
Bias Score [1] |
RMSE Score [1] |
Seasonal Cycle Score [1] |
Spatial Distribution Score [1] |
Interannual Variability Score [1] |
Overall Score [1] |
|||
|---|---|---|---|---|---|---|---|---|---|---|---|---|---|---|---|---|---|
| Benchmark | [-] | -84.3 | |||||||||||||||
| CTC_CBGC_20180719 | [-] | -85.2 | -86.8 | 0.00 | -88.9 | -49.1 | 2.10 | 23.5 | 0.714 | 0.63 | 0.46 | 0.89 | 0.92 | 0.76 | 0.69 | ||
| ECA_CBGC_20180729 | [-] | -86.8 | -88.3 | 0.00 | -88.9 | -49.1 | 0.615 | 23.3 | 0.694 | 0.63 | 0.46 | 0.90 | 0.91 | 0.74 | 0.68 |
Download Data |
Period Mean (original grids) [Watt m-2] |
Model Period Mean (intersection) [Watt m-2] |
Model Period Mean (complement) [Watt m-2] |
Benchmark Period Mean (intersection) [Watt m-2] |
Benchmark Period Mean (complement) [Watt m-2] |
Bias [Watt m-2] |
RMSE [Watt m-2] |
Phase Shift [months] |
Bias Score [1] |
RMSE Score [1] |
Seasonal Cycle Score [1] |
Spatial Distribution Score [1] |
Interannual Variability Score [1] |
Overall Score [1] |
|||
|---|---|---|---|---|---|---|---|---|---|---|---|---|---|---|---|---|---|
| Benchmark | [-] | -44.2 | |||||||||||||||
| CTC_CBGC_20180719 | [-] | -56.4 | -57.2 | 0.00 | -43.4 | -47.3 | -13.8 | 21.8 | 2.59 | 0.28 | 0.18 | 0.59 | 0.43 | 0.46 | 0.35 | ||
| ECA_CBGC_20180729 | [-] | -58.8 | -59.4 | 0.00 | -43.4 | -47.3 | -16.1 | 22.3 | 2.72 | 0.25 | 0.19 | 0.57 | 0.45 | 0.49 | 0.35 |
Download Data |
Period Mean (original grids) [Watt m-2] |
Model Period Mean (intersection) [Watt m-2] |
Model Period Mean (complement) [Watt m-2] |
Benchmark Period Mean (intersection) [Watt m-2] |
Benchmark Period Mean (complement) [Watt m-2] |
Bias [Watt m-2] |
RMSE [Watt m-2] |
Phase Shift [months] |
Bias Score [1] |
RMSE Score [1] |
Seasonal Cycle Score [1] |
Spatial Distribution Score [1] |
Interannual Variability Score [1] |
Overall Score [1] |
|||
|---|---|---|---|---|---|---|---|---|---|---|---|---|---|---|---|---|---|
| Benchmark | [-] | -59.5 | |||||||||||||||
| CTC_CBGC_20180719 | [-] | -68.4 | -68.4 | 0.00 | -63.6 | -50.0 | -4.83 | 22.6 | 1.21 | 0.66 | 0.33 | 0.83 | 0.98 | 0.74 | 0.65 | ||
| ECA_CBGC_20180729 | [-] | -72.0 | -72.0 | 0.00 | -63.6 | -50.0 | -8.41 | 23.1 | 1.17 | 0.59 | 0.34 | 0.83 | 0.99 | 0.73 | 0.64 |
Download Data |
Period Mean (original grids) [Watt m-2] |
Model Period Mean (intersection) [Watt m-2] |
Model Period Mean (complement) [Watt m-2] |
Benchmark Period Mean (intersection) [Watt m-2] |
Benchmark Period Mean (complement) [Watt m-2] |
Bias [Watt m-2] |
RMSE [Watt m-2] |
Phase Shift [months] |
Bias Score [1] |
RMSE Score [1] |
Seasonal Cycle Score [1] |
Spatial Distribution Score [1] |
Interannual Variability Score [1] |
Overall Score [1] |
|||
|---|---|---|---|---|---|---|---|---|---|---|---|---|---|---|---|---|---|
| Benchmark | [-] | -72.4 | |||||||||||||||
| CTC_CBGC_20180719 | [-] | -79.4 | -79.0 | 0.00 | -77.1 | -54.1 | -1.83 | 23.7 | 0.994 | 0.58 | 0.38 | 0.87 | 0.94 | 0.78 | 0.66 | ||
| ECA_CBGC_20180729 | [-] | -81.2 | -80.8 | 0.00 | -77.1 | -54.1 | -3.68 | 23.3 | 0.981 | 0.60 | 0.39 | 0.87 | 0.91 | 0.77 | 0.66 |
Download Data |
Period Mean (original grids) [Watt m-2] |
Model Period Mean (intersection) [Watt m-2] |
Model Period Mean (complement) [Watt m-2] |
Benchmark Period Mean (intersection) [Watt m-2] |
Benchmark Period Mean (complement) [Watt m-2] |
Bias [Watt m-2] |
RMSE [Watt m-2] |
Phase Shift [months] |
Bias Score [1] |
RMSE Score [1] |
Seasonal Cycle Score [1] |
Spatial Distribution Score [1] |
Interannual Variability Score [1] |
Overall Score [1] |
|||
|---|---|---|---|---|---|---|---|---|---|---|---|---|---|---|---|---|---|
| Benchmark | [-] | -55.3 | |||||||||||||||
| CTC_CBGC_20180719 | [-] | -69.2 | -69.0 | 0.00 | -60.7 | -47.2 | -8.23 | 22.0 | 1.41 | 0.45 | 0.34 | 0.80 | 0.95 | 0.72 | 0.60 | ||
| ECA_CBGC_20180729 | [-] | -70.3 | -70.0 | 0.00 | -60.7 | -47.2 | -9.29 | 21.3 | 1.37 | 0.45 | 0.35 | 0.81 | 0.97 | 0.73 | 0.61 |
Download Data |
Period Mean (original grids) [Watt m-2] |
Model Period Mean (intersection) [Watt m-2] |
Model Period Mean (complement) [Watt m-2] |
Benchmark Period Mean (intersection) [Watt m-2] |
Benchmark Period Mean (complement) [Watt m-2] |
Bias [Watt m-2] |
RMSE [Watt m-2] |
Phase Shift [months] |
Bias Score [1] |
RMSE Score [1] |
Seasonal Cycle Score [1] |
Spatial Distribution Score [1] |
Interannual Variability Score [1] |
Overall Score [1] |
|||
|---|---|---|---|---|---|---|---|---|---|---|---|---|---|---|---|---|---|
| Benchmark | [-] | -62.7 | |||||||||||||||
| CTC_CBGC_20180719 | [-] | -64.2 | -64.3 | 0.00 | -64.1 | -52.9 | -0.270 | 19.7 | 0.815 | 0.62 | 0.40 | 0.89 | 0.90 | 0.80 | 0.67 | ||
| ECA_CBGC_20180729 | [-] | -67.7 | -67.8 | 0.00 | -64.1 | -52.9 | -3.75 | 20.4 | 0.696 | 0.55 | 0.40 | 0.91 | 0.89 | 0.80 | 0.66 |
Temporally integrated period mean