Mean State
Download Data |
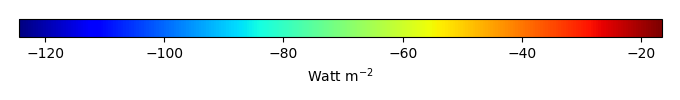
Period Mean (original grids) [Watt m-2] |
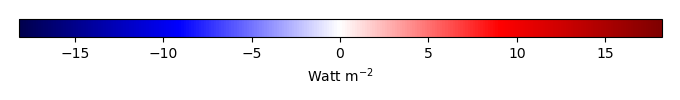
Bias [Watt m-2] |
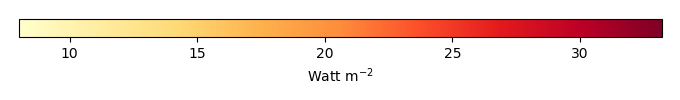
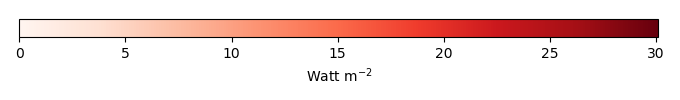
RMSE [Watt m-2] |
Phase Shift [months] |
Bias Score [1] |
RMSE Score [1] |
Seasonal Cycle Score [1] |
Interannual Variability Score [1] |
Overall Score [1] |
|||
|---|---|---|---|---|---|---|---|---|---|---|---|---|
| Benchmark | [-] | -31.3 | ||||||||||
| CTC_CBGC_20180719 | [-] | -44.7 | 1.50 | 12.0 | 1.02 | 0.43 | 0.31 | 0.93 | 0.92 | 0.58 | ||
| ECA_CBGC_20180729 | [-] | -47.0 | 1.45 | 11.8 | 1.02 | 0.43 | 0.31 | 0.93 | 0.94 | 0.59 |
Download Data |
Period Mean (original grids) [Watt m-2] |
Bias [Watt m-2] |
RMSE [Watt m-2] |
Phase Shift [months] |
Bias Score [1] |
RMSE Score [1] |
Seasonal Cycle Score [1] |
Interannual Variability Score [1] |
Overall Score [1] |
|||
|---|---|---|---|---|---|---|---|---|---|---|---|---|
| Benchmark | [-] | -49.3 | ||||||||||
| CTC_CBGC_20180719 | [-] | -46.9 | 8.49 | 23.0 | 1.03 | 0.16 | 0.45 | 0.93 | 0.83 | 0.57 | ||
| ECA_CBGC_20180729 | [-] | -49.6 | 3.05 | 25.2 | 1.03 | 0.13 | 0.43 | 0.93 | 0.74 | 0.53 |
Download Data |
Period Mean (original grids) [Watt m-2] |
Bias [Watt m-2] |
RMSE [Watt m-2] |
Phase Shift [months] |
Bias Score [1] |
RMSE Score [1] |
Seasonal Cycle Score [1] |
Interannual Variability Score [1] |
Overall Score [1] |
|||
|---|---|---|---|---|---|---|---|---|---|---|---|---|
| Benchmark | [-] | -64.6 | ||||||||||
| CTC_CBGC_20180719 | [-] | -61.0 | 2.92 | 18.3 | 0.949 | 0.19 | 0.35 | 0.89 | 0.80 | 0.52 | ||
| ECA_CBGC_20180729 | [-] | -63.7 | 0.136 | 19.3 | 0.695 | 0.16 | 0.36 | 0.91 | 0.80 | 0.52 |
Download Data |
Period Mean (original grids) [Watt m-2] |
Bias [Watt m-2] |
RMSE [Watt m-2] |
Phase Shift [months] |
Bias Score [1] |
RMSE Score [1] |
Seasonal Cycle Score [1] |
Interannual Variability Score [1] |
Overall Score [1] |
|||
|---|---|---|---|---|---|---|---|---|---|---|---|---|
| Benchmark | [-] | -109. | ||||||||||
| CTC_CBGC_20180719 | [-] | -115. | -6.61 | 17.6 | 1.03 | 0.24 | 0.42 | 0.93 | 0.91 | 0.59 | ||
| ECA_CBGC_20180729 | [-] | -117. | -9.63 | 18.4 | 0.00 | 0.21 | 0.47 | 1.0 | 0.92 | 0.61 |
Download Data |
Period Mean (original grids) [Watt m-2] |
Bias [Watt m-2] |
RMSE [Watt m-2] |
Phase Shift [months] |
Bias Score [1] |
RMSE Score [1] |
Seasonal Cycle Score [1] |
Interannual Variability Score [1] |
Overall Score [1] |
|||
|---|---|---|---|---|---|---|---|---|---|---|---|---|
| Benchmark | [-] | -69.9 | ||||||||||
| CTC_CBGC_20180719 | [-] | -67.9 | 2.14 | 19.2 | 0.339 | 0.44 | 0.32 | 0.98 | 0.77 | 0.57 | ||
| ECA_CBGC_20180729 | [-] | -71.0 | -1.17 | 18.7 | 0.115 | 0.38 | 0.34 | 0.99 | 0.78 | 0.56 |
Temporally integrated period mean