Mean State
Download Data |
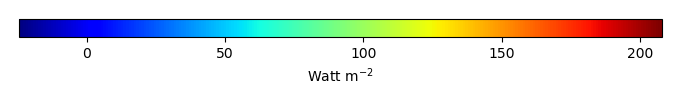
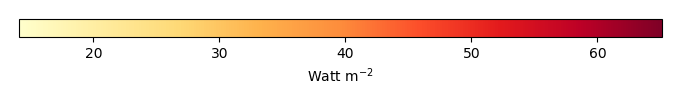
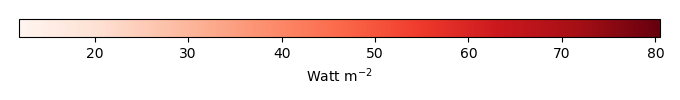
Period Mean (original grids) [Watt m-2] |
Model Period Mean (intersection) [Watt m-2] |
Model Period Mean (complement) [Watt m-2] |
Benchmark Period Mean (intersection) [Watt m-2] |
Benchmark Period Mean (complement) [Watt m-2] |
Bias [Watt m-2] |
RMSE [Watt m-2] |
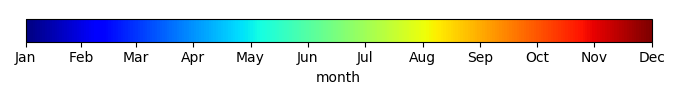
Phase Shift [months] |
Bias Score [1] |
RMSE Score [1] |
Seasonal Cycle Score [1] |
Spatial Distribution Score [1] |
Interannual Variability Score [1] |
Overall Score [1] |
|||
|---|---|---|---|---|---|---|---|---|---|---|---|---|---|---|---|---|---|
| Benchmark | [-] | 119. | |||||||||||||||
| CTC_CBGC_20180719 | [-] | 117. | 117. | 0.00 | 104. | 156. | 13.8 | 35.3 | 0.469 | 0.52 | 0.60 | 0.96 | 0.51 | 0.82 | 0.67 | ||
| ECA_CBGC_20180729 | [-] | 117. | 117. | 0.00 | 104. | 156. | 13.6 | 35.7 | 0.425 | 0.51 | 0.60 | 0.97 | 0.54 | 0.82 | 0.67 |
Download Data |
Period Mean (original grids) [Watt m-2] |
Model Period Mean (intersection) [Watt m-2] |
Model Period Mean (complement) [Watt m-2] |
Benchmark Period Mean (intersection) [Watt m-2] |
Benchmark Period Mean (complement) [Watt m-2] |
Bias [Watt m-2] |
RMSE [Watt m-2] |
Phase Shift [months] |
Bias Score [1] |
RMSE Score [1] |
Seasonal Cycle Score [1] |
Spatial Distribution Score [1] |
Interannual Variability Score [1] |
Overall Score [1] |
|||
|---|---|---|---|---|---|---|---|---|---|---|---|---|---|---|---|---|---|
| Benchmark | [-] | 52.2 | |||||||||||||||
| CTC_CBGC_20180719 | [-] | 37.5 | 37.6 | 0.00 | 52.4 | 53.6 | -14.7 | 23.7 | 0.313 | 0.78 | 0.72 | 0.98 | 0.95 | 0.89 | 0.84 | ||
| ECA_CBGC_20180729 | [-] | 34.4 | 34.6 | 0.00 | 52.4 | 53.6 | -17.8 | 27.8 | 0.445 | 0.74 | 0.69 | 0.97 | 0.84 | 0.87 | 0.80 |
Download Data |
Period Mean (original grids) [Watt m-2] |
Model Period Mean (intersection) [Watt m-2] |
Model Period Mean (complement) [Watt m-2] |
Benchmark Period Mean (intersection) [Watt m-2] |
Benchmark Period Mean (complement) [Watt m-2] |
Bias [Watt m-2] |
RMSE [Watt m-2] |
Phase Shift [months] |
Bias Score [1] |
RMSE Score [1] |
Seasonal Cycle Score [1] |
Spatial Distribution Score [1] |
Interannual Variability Score [1] |
Overall Score [1] |
|||
|---|---|---|---|---|---|---|---|---|---|---|---|---|---|---|---|---|---|
| Benchmark | [-] | 50.6 | |||||||||||||||
| CTC_CBGC_20180719 | [-] | 35.0 | 35.1 | 0.00 | 50.9 | 49.9 | -15.9 | 25.1 | 0.260 | 0.75 | 0.70 | 0.98 | 0.91 | 0.84 | 0.81 | ||
| ECA_CBGC_20180729 | [-] | 33.9 | 34.0 | 0.00 | 50.9 | 49.9 | -16.9 | 25.7 | 0.212 | 0.74 | 0.70 | 0.99 | 0.90 | 0.84 | 0.81 |
Download Data |
Period Mean (original grids) [Watt m-2] |
Model Period Mean (intersection) [Watt m-2] |
Model Period Mean (complement) [Watt m-2] |
Benchmark Period Mean (intersection) [Watt m-2] |
Benchmark Period Mean (complement) [Watt m-2] |
Bias [Watt m-2] |
RMSE [Watt m-2] |
Phase Shift [months] |
Bias Score [1] |
RMSE Score [1] |
Seasonal Cycle Score [1] |
Spatial Distribution Score [1] |
Interannual Variability Score [1] |
Overall Score [1] |
|||
|---|---|---|---|---|---|---|---|---|---|---|---|---|---|---|---|---|---|
| Benchmark | [-] | 151. | |||||||||||||||
| CTC_CBGC_20180719 | [-] | 135. | 135. | 0.00 | 136. | 171. | -0.636 | 29.0 | 0.912 | 0.57 | 0.58 | 0.91 | 0.52 | 0.83 | 0.67 | ||
| ECA_CBGC_20180729 | [-] | 133. | 133. | 0.00 | 136. | 171. | -3.07 | 28.1 | 0.904 | 0.60 | 0.58 | 0.91 | 0.50 | 0.83 | 0.67 |
Download Data |
Period Mean (original grids) [Watt m-2] |
Model Period Mean (intersection) [Watt m-2] |
Model Period Mean (complement) [Watt m-2] |
Benchmark Period Mean (intersection) [Watt m-2] |
Benchmark Period Mean (complement) [Watt m-2] |
Bias [Watt m-2] |
RMSE [Watt m-2] |
Phase Shift [months] |
Bias Score [1] |
RMSE Score [1] |
Seasonal Cycle Score [1] |
Spatial Distribution Score [1] |
Interannual Variability Score [1] |
Overall Score [1] |
|||
|---|---|---|---|---|---|---|---|---|---|---|---|---|---|---|---|---|---|
| Benchmark | [-] | 71.7 | |||||||||||||||
| CTC_CBGC_20180719 | [-] | 67.9 | 67.9 | 0.00 | 70.5 | 110. | -2.73 | 28.8 | 0.684 | 0.75 | 0.58 | 0.95 | 0.98 | 0.80 | 0.77 | ||
| ECA_CBGC_20180729 | [-] | 67.8 | 67.8 | 0.00 | 70.5 | 110. | -2.79 | 29.5 | 0.646 | 0.74 | 0.57 | 0.95 | 0.97 | 0.78 | 0.77 |
Download Data |
Period Mean (original grids) [Watt m-2] |
Model Period Mean (intersection) [Watt m-2] |
Model Period Mean (complement) [Watt m-2] |
Benchmark Period Mean (intersection) [Watt m-2] |
Benchmark Period Mean (complement) [Watt m-2] |
Bias [Watt m-2] |
RMSE [Watt m-2] |
Phase Shift [months] |
Bias Score [1] |
RMSE Score [1] |
Seasonal Cycle Score [1] |
Spatial Distribution Score [1] |
Interannual Variability Score [1] |
Overall Score [1] |
|||
|---|---|---|---|---|---|---|---|---|---|---|---|---|---|---|---|---|---|
| Benchmark | [-] | 159. | |||||||||||||||
| CTC_CBGC_20180719 | [-] | 147. | 147. | 0.00 | 153. | 169. | -6.17 | 31.1 | 1.46 | 0.52 | 0.32 | 0.82 | 0.41 | 0.87 | 0.54 | ||
| ECA_CBGC_20180729 | [-] | 141. | 141. | 0.00 | 153. | 169. | -11.9 | 32.8 | 1.33 | 0.47 | 0.33 | 0.83 | 0.52 | 0.83 | 0.55 |
Download Data |
Period Mean (original grids) [Watt m-2] |
Model Period Mean (intersection) [Watt m-2] |
Model Period Mean (complement) [Watt m-2] |
Benchmark Period Mean (intersection) [Watt m-2] |
Benchmark Period Mean (complement) [Watt m-2] |
Bias [Watt m-2] |
RMSE [Watt m-2] |
Phase Shift [months] |
Bias Score [1] |
RMSE Score [1] |
Seasonal Cycle Score [1] |
Spatial Distribution Score [1] |
Interannual Variability Score [1] |
Overall Score [1] |
|||
|---|---|---|---|---|---|---|---|---|---|---|---|---|---|---|---|---|---|
| Benchmark | [-] | 69.0 | |||||||||||||||
| CTC_CBGC_20180719 | [-] | 68.8 | 68.5 | 0.00 | 68.6 | 71.2 | -0.153 | 23.3 | 0.286 | 0.82 | 0.72 | 0.98 | 0.94 | 0.83 | 0.83 | ||
| ECA_CBGC_20180729 | [-] | 67.9 | 67.5 | 0.00 | 68.6 | 71.2 | -1.10 | 22.6 | 0.287 | 0.83 | 0.73 | 0.98 | 0.92 | 0.84 | 0.84 |
Download Data |
Period Mean (original grids) [Watt m-2] |
Model Period Mean (intersection) [Watt m-2] |
Model Period Mean (complement) [Watt m-2] |
Benchmark Period Mean (intersection) [Watt m-2] |
Benchmark Period Mean (complement) [Watt m-2] |
Bias [Watt m-2] |
RMSE [Watt m-2] |
Phase Shift [months] |
Bias Score [1] |
RMSE Score [1] |
Seasonal Cycle Score [1] |
Spatial Distribution Score [1] |
Interannual Variability Score [1] |
Overall Score [1] |
|||
|---|---|---|---|---|---|---|---|---|---|---|---|---|---|---|---|---|---|
| Benchmark | [-] | 115. | |||||||||||||||
| CTC_CBGC_20180719 | [-] | 89.6 | 81.7 | 0.00 | 84.4 | 134. | -2.70 | 28.9 | 0.801 | 0.61 | 0.56 | 0.91 | 0.93 | 0.82 | 0.73 | ||
| ECA_CBGC_20180729 | [-] | 88.2 | 80.4 | 0.00 | 84.4 | 134. | -4.05 | 29.3 | 0.773 | 0.61 | 0.56 | 0.91 | 0.93 | 0.81 | 0.73 |
Download Data |
Period Mean (original grids) [Watt m-2] |
Model Period Mean (intersection) [Watt m-2] |
Model Period Mean (complement) [Watt m-2] |
Benchmark Period Mean (intersection) [Watt m-2] |
Benchmark Period Mean (complement) [Watt m-2] |
Bias [Watt m-2] |
RMSE [Watt m-2] |
Phase Shift [months] |
Bias Score [1] |
RMSE Score [1] |
Seasonal Cycle Score [1] |
Spatial Distribution Score [1] |
Interannual Variability Score [1] |
Overall Score [1] |
|||
|---|---|---|---|---|---|---|---|---|---|---|---|---|---|---|---|---|---|
| Benchmark | [-] | 63.6 | |||||||||||||||
| CTC_CBGC_20180719 | [-] | 70.2 | 70.6 | 0.00 | 59.4 | 143. | 11.3 | 33.8 | 1.15 | 0.49 | 0.52 | 0.87 | 0.55 | 0.84 | 0.63 | ||
| ECA_CBGC_20180729 | [-] | 70.5 | 70.9 | 0.00 | 59.4 | 143. | 11.7 | 34.1 | 1.12 | 0.49 | 0.52 | 0.88 | 0.54 | 0.83 | 0.63 |
Download Data |
Period Mean (original grids) [Watt m-2] |
Model Period Mean (intersection) [Watt m-2] |
Model Period Mean (complement) [Watt m-2] |
Benchmark Period Mean (intersection) [Watt m-2] |
Benchmark Period Mean (complement) [Watt m-2] |
Bias [Watt m-2] |
RMSE [Watt m-2] |
Phase Shift [months] |
Bias Score [1] |
RMSE Score [1] |
Seasonal Cycle Score [1] |
Spatial Distribution Score [1] |
Interannual Variability Score [1] |
Overall Score [1] |
|||
|---|---|---|---|---|---|---|---|---|---|---|---|---|---|---|---|---|---|
| Benchmark | [-] | 105. | |||||||||||||||
| CTC_CBGC_20180719 | [-] | 104. | 102. | 0.00 | 95.9 | 172. | 6.34 | 25.5 | 1.41 | 0.58 | 0.43 | 0.81 | 0.94 | 0.77 | 0.66 | ||
| ECA_CBGC_20180729 | [-] | 104. | 102. | 0.00 | 95.9 | 172. | 5.82 | 25.5 | 1.39 | 0.59 | 0.43 | 0.81 | 0.94 | 0.76 | 0.66 |
Download Data |
Period Mean (original grids) [Watt m-2] |
Model Period Mean (intersection) [Watt m-2] |
Model Period Mean (complement) [Watt m-2] |
Benchmark Period Mean (intersection) [Watt m-2] |
Benchmark Period Mean (complement) [Watt m-2] |
Bias [Watt m-2] |
RMSE [Watt m-2] |
Phase Shift [months] |
Bias Score [1] |
RMSE Score [1] |
Seasonal Cycle Score [1] |
Spatial Distribution Score [1] |
Interannual Variability Score [1] |
Overall Score [1] |
|||
|---|---|---|---|---|---|---|---|---|---|---|---|---|---|---|---|---|---|
| Benchmark | [-] | 151. | |||||||||||||||
| CTC_CBGC_20180719 | [-] | 148. | 148. | 0.00 | 142. | 188. | 5.98 | 29.7 | 1.44 | 0.47 | 0.35 | 0.78 | 0.36 | 0.81 | 0.52 | ||
| ECA_CBGC_20180729 | [-] | 144. | 144. | 0.00 | 142. | 188. | 2.59 | 27.7 | 1.56 | 0.52 | 0.36 | 0.76 | 0.48 | 0.82 | 0.55 |
Download Data |
Period Mean (original grids) [Watt m-2] |
Model Period Mean (intersection) [Watt m-2] |
Model Period Mean (complement) [Watt m-2] |
Benchmark Period Mean (intersection) [Watt m-2] |
Benchmark Period Mean (complement) [Watt m-2] |
Bias [Watt m-2] |
RMSE [Watt m-2] |
Phase Shift [months] |
Bias Score [1] |
RMSE Score [1] |
Seasonal Cycle Score [1] |
Spatial Distribution Score [1] |
Interannual Variability Score [1] |
Overall Score [1] |
|||
|---|---|---|---|---|---|---|---|---|---|---|---|---|---|---|---|---|---|
| Benchmark | [-] | 129. | |||||||||||||||
| CTC_CBGC_20180719 | [-] | 122. | 122. | 0.00 | 112. | 169. | 10.1 | 34.4 | 1.01 | 0.52 | 0.44 | 0.89 | 0.74 | 0.81 | 0.64 | ||
| ECA_CBGC_20180729 | [-] | 120. | 120. | 0.00 | 112. | 169. | 8.08 | 33.6 | 0.773 | 0.53 | 0.45 | 0.93 | 0.70 | 0.81 | 0.64 |
Download Data |
Period Mean (original grids) [Watt m-2] |
Model Period Mean (intersection) [Watt m-2] |
Model Period Mean (complement) [Watt m-2] |
Benchmark Period Mean (intersection) [Watt m-2] |
Benchmark Period Mean (complement) [Watt m-2] |
Bias [Watt m-2] |
RMSE [Watt m-2] |
Phase Shift [months] |
Bias Score [1] |
RMSE Score [1] |
Seasonal Cycle Score [1] |
Spatial Distribution Score [1] |
Interannual Variability Score [1] |
Overall Score [1] |
|||
|---|---|---|---|---|---|---|---|---|---|---|---|---|---|---|---|---|---|
| Benchmark | [-] | 127. | |||||||||||||||
| CTC_CBGC_20180719 | [-] | 128. | 128. | 0.00 | 116. | 168. | 12.7 | 30.2 | 1.03 | 0.47 | 0.51 | 0.86 | 0.59 | 0.84 | 0.63 | ||
| ECA_CBGC_20180729 | [-] | 125. | 126. | 0.00 | 116. | 168. | 10.2 | 28.6 | 1.13 | 0.51 | 0.52 | 0.84 | 0.57 | 0.84 | 0.63 |
Download Data |
Period Mean (original grids) [Watt m-2] |
Model Period Mean (intersection) [Watt m-2] |
Model Period Mean (complement) [Watt m-2] |
Benchmark Period Mean (intersection) [Watt m-2] |
Benchmark Period Mean (complement) [Watt m-2] |
Bias [Watt m-2] |
RMSE [Watt m-2] |
Phase Shift [months] |
Bias Score [1] |
RMSE Score [1] |
Seasonal Cycle Score [1] |
Spatial Distribution Score [1] |
Interannual Variability Score [1] |
Overall Score [1] |
|||
|---|---|---|---|---|---|---|---|---|---|---|---|---|---|---|---|---|---|
| Benchmark | [-] | 117. | |||||||||||||||
| CTC_CBGC_20180719 | [-] | 126. | 126. | 0.00 | 115. | 119. | 10.5 | 27.9 | 1.05 | 0.57 | 0.50 | 0.86 | 0.97 | 0.83 | 0.70 | ||
| ECA_CBGC_20180729 | [-] | 125. | 125. | 0.00 | 115. | 119. | 9.58 | 27.6 | 1.02 | 0.58 | 0.50 | 0.86 | 0.97 | 0.82 | 0.71 |
Download Data |
Period Mean (original grids) [Watt m-2] |
Model Period Mean (intersection) [Watt m-2] |
Model Period Mean (complement) [Watt m-2] |
Benchmark Period Mean (intersection) [Watt m-2] |
Benchmark Period Mean (complement) [Watt m-2] |
Bias [Watt m-2] |
RMSE [Watt m-2] |
Phase Shift [months] |
Bias Score [1] |
RMSE Score [1] |
Seasonal Cycle Score [1] |
Spatial Distribution Score [1] |
Interannual Variability Score [1] |
Overall Score [1] |
|||
|---|---|---|---|---|---|---|---|---|---|---|---|---|---|---|---|---|---|
| Benchmark | [-] | 92.4 | |||||||||||||||
| CTC_CBGC_20180719 | [-] | 89.3 | 89.3 | 0.00 | 88.7 | 127. | 0.672 | 22.8 | 0.639 | 0.83 | 0.67 | 0.95 | 0.99 | 0.83 | 0.82 | ||
| ECA_CBGC_20180729 | [-] | 88.3 | 88.3 | 0.00 | 88.7 | 127. | -0.308 | 22.7 | 0.617 | 0.83 | 0.67 | 0.96 | 0.99 | 0.83 | 0.82 |
Temporally integrated period mean