Mean State
Download Data |
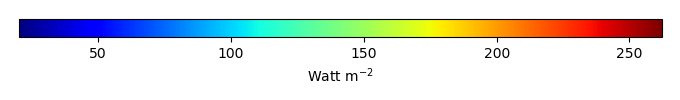
Period Mean (original grids) [Watt m-2] |
Model Period Mean (intersection) [Watt m-2] |
Model Period Mean (complement) [Watt m-2] |
Benchmark Period Mean (intersection) [Watt m-2] |
Benchmark Period Mean (complement) [Watt m-2] |
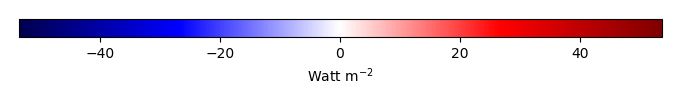
Bias [Watt m-2] |
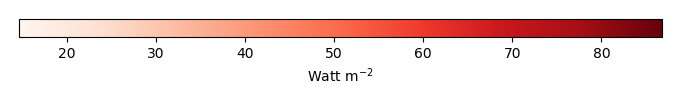
RMSE [Watt m-2] |
Phase Shift [months] |
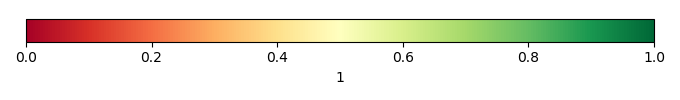
Bias Score [1] |
RMSE Score [1] |
Seasonal Cycle Score [1] |
Spatial Distribution Score [1] |
Interannual Variability Score [1] |
Overall Score [1] |
|||
|---|---|---|---|---|---|---|---|---|---|---|---|---|---|---|---|---|---|
| Benchmark | [-] | 203. | |||||||||||||||
| CTC_CBGC_20180719 | [-] | 204. | 204. | 0.00 | 199. | 210. | 5.35 | 31.0 | 0.453 | 0.73 | 0.56 | 0.97 | 0.99 | 0.81 | 0.77 | ||
| ECA_CBGC_20180729 | [-] | 205. | 205. | 0.00 | 199. | 210. | 5.38 | 31.2 | 0.366 | 0.73 | 0.55 | 0.98 | 0.99 | 0.82 | 0.77 |
Download Data |
Period Mean (original grids) [Watt m-2] |
Model Period Mean (intersection) [Watt m-2] |
Model Period Mean (complement) [Watt m-2] |
Benchmark Period Mean (intersection) [Watt m-2] |
Benchmark Period Mean (complement) [Watt m-2] |
Bias [Watt m-2] |
RMSE [Watt m-2] |
Phase Shift [months] |
Bias Score [1] |
RMSE Score [1] |
Seasonal Cycle Score [1] |
Spatial Distribution Score [1] |
Interannual Variability Score [1] |
Overall Score [1] |
|||
|---|---|---|---|---|---|---|---|---|---|---|---|---|---|---|---|---|---|
| Benchmark | [-] | 90.9 | |||||||||||||||
| CTC_CBGC_20180719 | [-] | 71.5 | 71.7 | 0.00 | 90.7 | 101. | -19.0 | 30.8 | 0.411 | 0.77 | 0.70 | 0.97 | 0.89 | 0.87 | 0.82 | ||
| ECA_CBGC_20180729 | [-] | 70.5 | 70.7 | 0.00 | 90.7 | 101. | -19.9 | 34.3 | 0.474 | 0.76 | 0.68 | 0.97 | 0.72 | 0.86 | 0.78 |
Download Data |
Period Mean (original grids) [Watt m-2] |
Model Period Mean (intersection) [Watt m-2] |
Model Period Mean (complement) [Watt m-2] |
Benchmark Period Mean (intersection) [Watt m-2] |
Benchmark Period Mean (complement) [Watt m-2] |
Bias [Watt m-2] |
RMSE [Watt m-2] |
Phase Shift [months] |
Bias Score [1] |
RMSE Score [1] |
Seasonal Cycle Score [1] |
Spatial Distribution Score [1] |
Interannual Variability Score [1] |
Overall Score [1] |
|||
|---|---|---|---|---|---|---|---|---|---|---|---|---|---|---|---|---|---|
| Benchmark | [-] | 87.7 | |||||||||||||||
| CTC_CBGC_20180719 | [-] | 68.8 | 68.8 | 0.00 | 88.1 | 86.5 | -19.4 | 32.1 | 0.338 | 0.75 | 0.67 | 0.98 | 0.90 | 0.82 | 0.80 | ||
| ECA_CBGC_20180729 | [-] | 69.1 | 69.2 | 0.00 | 88.1 | 86.5 | -19.0 | 31.7 | 0.275 | 0.75 | 0.68 | 0.98 | 0.87 | 0.83 | 0.80 |
Download Data |
Period Mean (original grids) [Watt m-2] |
Model Period Mean (intersection) [Watt m-2] |
Model Period Mean (complement) [Watt m-2] |
Benchmark Period Mean (intersection) [Watt m-2] |
Benchmark Period Mean (complement) [Watt m-2] |
Bias [Watt m-2] |
RMSE [Watt m-2] |
Phase Shift [months] |
Bias Score [1] |
RMSE Score [1] |
Seasonal Cycle Score [1] |
Spatial Distribution Score [1] |
Interannual Variability Score [1] |
Overall Score [1] |
|||
|---|---|---|---|---|---|---|---|---|---|---|---|---|---|---|---|---|---|
| Benchmark | [-] | 214. | |||||||||||||||
| CTC_CBGC_20180719 | [-] | 212. | 211. | 0.00 | 205. | 225. | 6.67 | 32.5 | 0.751 | 0.65 | 0.51 | 0.94 | 0.54 | 0.79 | 0.65 | ||
| ECA_CBGC_20180729 | [-] | 211. | 211. | 0.00 | 205. | 225. | 6.40 | 32.4 | 0.767 | 0.66 | 0.50 | 0.94 | 0.55 | 0.80 | 0.66 |
Download Data |
Period Mean (original grids) [Watt m-2] |
Model Period Mean (intersection) [Watt m-2] |
Model Period Mean (complement) [Watt m-2] |
Benchmark Period Mean (intersection) [Watt m-2] |
Benchmark Period Mean (complement) [Watt m-2] |
Bias [Watt m-2] |
RMSE [Watt m-2] |
Phase Shift [months] |
Bias Score [1] |
RMSE Score [1] |
Seasonal Cycle Score [1] |
Spatial Distribution Score [1] |
Interannual Variability Score [1] |
Overall Score [1] |
|||
|---|---|---|---|---|---|---|---|---|---|---|---|---|---|---|---|---|---|
| Benchmark | [-] | 144. | |||||||||||||||
| CTC_CBGC_20180719 | [-] | 140. | 140. | 0.00 | 144. | 168. | -3.73 | 29.8 | 0.735 | 0.81 | 0.63 | 0.94 | 0.98 | 0.84 | 0.81 | ||
| ECA_CBGC_20180729 | [-] | 142. | 143. | 0.00 | 144. | 168. | -1.32 | 31.0 | 0.720 | 0.81 | 0.62 | 0.94 | 0.99 | 0.81 | 0.80 |
Download Data |
Period Mean (original grids) [Watt m-2] |
Model Period Mean (intersection) [Watt m-2] |
Model Period Mean (complement) [Watt m-2] |
Benchmark Period Mean (intersection) [Watt m-2] |
Benchmark Period Mean (complement) [Watt m-2] |
Bias [Watt m-2] |
RMSE [Watt m-2] |
Phase Shift [months] |
Bias Score [1] |
RMSE Score [1] |
Seasonal Cycle Score [1] |
Spatial Distribution Score [1] |
Interannual Variability Score [1] |
Overall Score [1] |
|||
|---|---|---|---|---|---|---|---|---|---|---|---|---|---|---|---|---|---|
| Benchmark | [-] | 205. | |||||||||||||||
| CTC_CBGC_20180719 | [-] | 186. | 186. | 0.00 | 199. | 216. | -13.3 | 37.7 | 1.35 | 0.50 | 0.30 | 0.83 | 0.65 | 0.84 | 0.57 | ||
| ECA_CBGC_20180729 | [-] | 189. | 189. | 0.00 | 199. | 216. | -10.3 | 36.2 | 1.30 | 0.53 | 0.30 | 0.84 | 0.73 | 0.86 | 0.59 |
Download Data |
Period Mean (original grids) [Watt m-2] |
Model Period Mean (intersection) [Watt m-2] |
Model Period Mean (complement) [Watt m-2] |
Benchmark Period Mean (intersection) [Watt m-2] |
Benchmark Period Mean (complement) [Watt m-2] |
Bias [Watt m-2] |
RMSE [Watt m-2] |
Phase Shift [months] |
Bias Score [1] |
RMSE Score [1] |
Seasonal Cycle Score [1] |
Spatial Distribution Score [1] |
Interannual Variability Score [1] |
Overall Score [1] |
|||
|---|---|---|---|---|---|---|---|---|---|---|---|---|---|---|---|---|---|
| Benchmark | [-] | 125. | |||||||||||||||
| CTC_CBGC_20180719 | [-] | 123. | 122. | 0.00 | 126. | 122. | -3.05 | 28.3 | 0.324 | 0.84 | 0.69 | 0.98 | 1.0 | 0.86 | 0.84 | ||
| ECA_CBGC_20180729 | [-] | 125. | 125. | 0.00 | 126. | 122. | -0.904 | 28.0 | 0.332 | 0.84 | 0.69 | 0.98 | 0.99 | 0.86 | 0.84 |
Download Data |
Period Mean (original grids) [Watt m-2] |
Model Period Mean (intersection) [Watt m-2] |
Model Period Mean (complement) [Watt m-2] |
Benchmark Period Mean (intersection) [Watt m-2] |
Benchmark Period Mean (complement) [Watt m-2] |
Bias [Watt m-2] |
RMSE [Watt m-2] |
Phase Shift [months] |
Bias Score [1] |
RMSE Score [1] |
Seasonal Cycle Score [1] |
Spatial Distribution Score [1] |
Interannual Variability Score [1] |
Overall Score [1] |
|||
|---|---|---|---|---|---|---|---|---|---|---|---|---|---|---|---|---|---|
| Benchmark | [-] | 168. | |||||||||||||||
| CTC_CBGC_20180719 | [-] | 159. | 145. | 0.00 | 148. | 180. | -2.96 | 31.0 | 0.702 | 0.66 | 0.55 | 0.93 | 0.95 | 0.83 | 0.75 | ||
| ECA_CBGC_20180729 | [-] | 160. | 146. | 0.00 | 148. | 180. | -2.10 | 31.2 | 0.678 | 0.66 | 0.55 | 0.93 | 0.95 | 0.83 | 0.74 |
Download Data |
Period Mean (original grids) [Watt m-2] |
Model Period Mean (intersection) [Watt m-2] |
Model Period Mean (complement) [Watt m-2] |
Benchmark Period Mean (intersection) [Watt m-2] |
Benchmark Period Mean (complement) [Watt m-2] |
Bias [Watt m-2] |
RMSE [Watt m-2] |
Phase Shift [months] |
Bias Score [1] |
RMSE Score [1] |
Seasonal Cycle Score [1] |
Spatial Distribution Score [1] |
Interannual Variability Score [1] |
Overall Score [1] |
|||
|---|---|---|---|---|---|---|---|---|---|---|---|---|---|---|---|---|---|
| Benchmark | [-] | 176. | |||||||||||||||
| CTC_CBGC_20180719 | [-] | 173. | 173. | 0.00 | 175. | 212. | -1.88 | 22.8 | 0.607 | 0.79 | 0.70 | 0.95 | 0.95 | 0.88 | 0.83 | ||
| ECA_CBGC_20180729 | [-] | 175. | 175. | 0.00 | 175. | 212. | 0.190 | 23.0 | 0.606 | 0.78 | 0.70 | 0.95 | 0.95 | 0.88 | 0.83 |
Download Data |
Period Mean (original grids) [Watt m-2] |
Model Period Mean (intersection) [Watt m-2] |
Model Period Mean (complement) [Watt m-2] |
Benchmark Period Mean (intersection) [Watt m-2] |
Benchmark Period Mean (complement) [Watt m-2] |
Bias [Watt m-2] |
RMSE [Watt m-2] |
Phase Shift [months] |
Bias Score [1] |
RMSE Score [1] |
Seasonal Cycle Score [1] |
Spatial Distribution Score [1] |
Interannual Variability Score [1] |
Overall Score [1] |
|||
|---|---|---|---|---|---|---|---|---|---|---|---|---|---|---|---|---|---|
| Benchmark | [-] | 189. | |||||||||||||||
| CTC_CBGC_20180719 | [-] | 190. | 189. | 0.00 | 185. | 221. | 4.24 | 25.2 | 1.01 | 0.58 | 0.43 | 0.89 | 0.94 | 0.85 | 0.68 | ||
| ECA_CBGC_20180729 | [-] | 191. | 190. | 0.00 | 185. | 221. | 5.21 | 25.2 | 1.05 | 0.57 | 0.43 | 0.87 | 0.93 | 0.83 | 0.68 |
Download Data |
Period Mean (original grids) [Watt m-2] |
Model Period Mean (intersection) [Watt m-2] |
Model Period Mean (complement) [Watt m-2] |
Benchmark Period Mean (intersection) [Watt m-2] |
Benchmark Period Mean (complement) [Watt m-2] |
Bias [Watt m-2] |
RMSE [Watt m-2] |
Phase Shift [months] |
Bias Score [1] |
RMSE Score [1] |
Seasonal Cycle Score [1] |
Spatial Distribution Score [1] |
Interannual Variability Score [1] |
Overall Score [1] |
|||
|---|---|---|---|---|---|---|---|---|---|---|---|---|---|---|---|---|---|
| Benchmark | [-] | 196. | |||||||||||||||
| CTC_CBGC_20180719 | [-] | 204. | 205. | 0.00 | 185. | 235. | 19.8 | 39.2 | 2.17 | 0.36 | 0.29 | 0.65 | 0.75 | 0.69 | 0.50 | ||
| ECA_CBGC_20180729 | [-] | 203. | 204. | 0.00 | 185. | 235. | 18.7 | 38.9 | 2.08 | 0.37 | 0.30 | 0.66 | 0.77 | 0.71 | 0.52 |
Download Data |
Period Mean (original grids) [Watt m-2] |
Model Period Mean (intersection) [Watt m-2] |
Model Period Mean (complement) [Watt m-2] |
Benchmark Period Mean (intersection) [Watt m-2] |
Benchmark Period Mean (complement) [Watt m-2] |
Bias [Watt m-2] |
RMSE [Watt m-2] |
Phase Shift [months] |
Bias Score [1] |
RMSE Score [1] |
Seasonal Cycle Score [1] |
Spatial Distribution Score [1] |
Interannual Variability Score [1] |
Overall Score [1] |
|||
|---|---|---|---|---|---|---|---|---|---|---|---|---|---|---|---|---|---|
| Benchmark | [-] | 189. | |||||||||||||||
| CTC_CBGC_20180719 | [-] | 191. | 191. | 0.00 | 176. | 219. | 15.0 | 42.4 | 0.830 | 0.50 | 0.38 | 0.93 | 0.75 | 0.75 | 0.61 | ||
| ECA_CBGC_20180729 | [-] | 192. | 192. | 0.00 | 176. | 219. | 16.5 | 42.7 | 0.766 | 0.49 | 0.39 | 0.94 | 0.74 | 0.76 | 0.62 |
Download Data |
Period Mean (original grids) [Watt m-2] |
Model Period Mean (intersection) [Watt m-2] |
Model Period Mean (complement) [Watt m-2] |
Benchmark Period Mean (intersection) [Watt m-2] |
Benchmark Period Mean (complement) [Watt m-2] |
Bias [Watt m-2] |
RMSE [Watt m-2] |
Phase Shift [months] |
Bias Score [1] |
RMSE Score [1] |
Seasonal Cycle Score [1] |
Spatial Distribution Score [1] |
Interannual Variability Score [1] |
Overall Score [1] |
|||
|---|---|---|---|---|---|---|---|---|---|---|---|---|---|---|---|---|---|
| Benchmark | [-] | 199. | |||||||||||||||
| CTC_CBGC_20180719 | [-] | 207. | 207. | 0.00 | 193. | 222. | 14.5 | 33.5 | 1.23 | 0.49 | 0.38 | 0.85 | 0.96 | 0.76 | 0.63 | ||
| ECA_CBGC_20180729 | [-] | 207. | 206. | 0.00 | 193. | 222. | 13.9 | 32.6 | 1.14 | 0.50 | 0.38 | 0.87 | 0.93 | 0.76 | 0.64 |
Download Data |
Period Mean (original grids) [Watt m-2] |
Model Period Mean (intersection) [Watt m-2] |
Model Period Mean (complement) [Watt m-2] |
Benchmark Period Mean (intersection) [Watt m-2] |
Benchmark Period Mean (complement) [Watt m-2] |
Bias [Watt m-2] |
RMSE [Watt m-2] |
Phase Shift [months] |
Bias Score [1] |
RMSE Score [1] |
Seasonal Cycle Score [1] |
Spatial Distribution Score [1] |
Interannual Variability Score [1] |
Overall Score [1] |
|||
|---|---|---|---|---|---|---|---|---|---|---|---|---|---|---|---|---|---|
| Benchmark | [-] | 172. | |||||||||||||||
| CTC_CBGC_20180719 | [-] | 195. | 195. | 0.00 | 176. | 166. | 18.8 | 36.6 | 0.871 | 0.48 | 0.46 | 0.90 | 0.89 | 0.83 | 0.67 | ||
| ECA_CBGC_20180729 | [-] | 195. | 195. | 0.00 | 176. | 166. | 18.9 | 36.2 | 0.802 | 0.49 | 0.47 | 0.91 | 0.89 | 0.84 | 0.68 |
Download Data |
Period Mean (original grids) [Watt m-2] |
Model Period Mean (intersection) [Watt m-2] |
Model Period Mean (complement) [Watt m-2] |
Benchmark Period Mean (intersection) [Watt m-2] |
Benchmark Period Mean (complement) [Watt m-2] |
Bias [Watt m-2] |
RMSE [Watt m-2] |
Phase Shift [months] |
Bias Score [1] |
RMSE Score [1] |
Seasonal Cycle Score [1] |
Spatial Distribution Score [1] |
Interannual Variability Score [1] |
Overall Score [1] |
|||
|---|---|---|---|---|---|---|---|---|---|---|---|---|---|---|---|---|---|
| Benchmark | [-] | 155. | |||||||||||||||
| CTC_CBGC_20180719 | [-] | 154. | 154. | 0.00 | 153. | 180. | 0.942 | 27.3 | 0.565 | 0.86 | 0.67 | 0.96 | 0.95 | 0.86 | 0.83 | ||
| ECA_CBGC_20180729 | [-] | 156. | 156. | 0.00 | 153. | 180. | 3.44 | 27.9 | 0.680 | 0.85 | 0.67 | 0.95 | 0.95 | 0.86 | 0.82 |
Temporally integrated period mean