MPAS-Analysis Diagnostics: Ocean
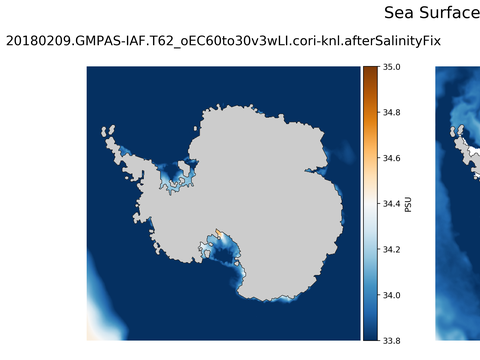
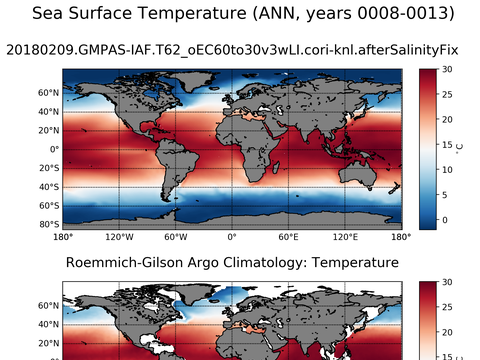
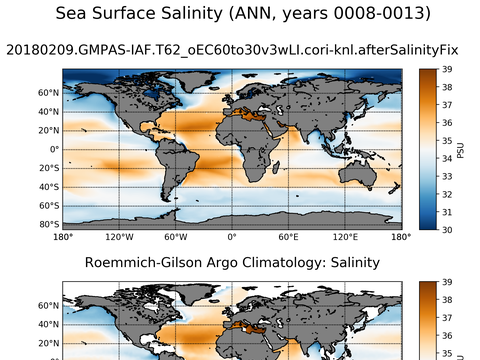
Run: 20180209.GMPAS-IAF.T62_oEC60to30v3wLI.cori-knl.afterSalinityFix
Quick Links

Global Mixed-Layer Depth
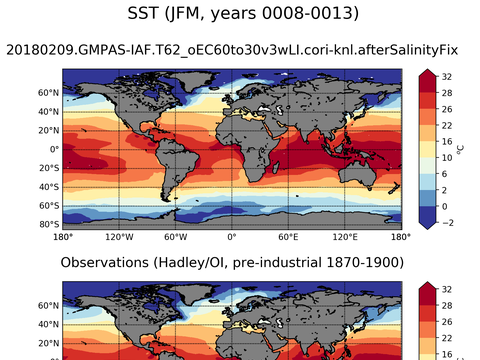
Global Sea Surface Temperature
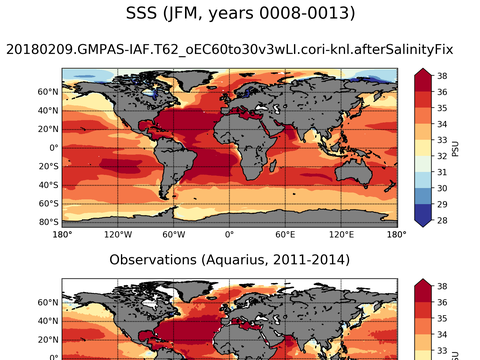
Global Sea Surface Salinity
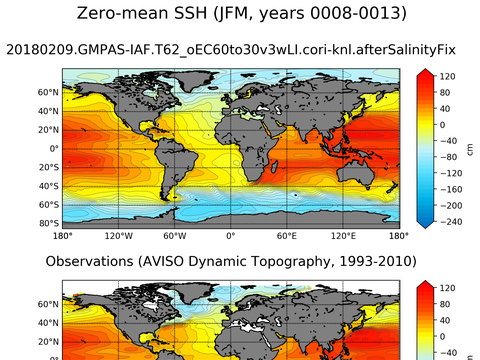
Global Sea Surface Height
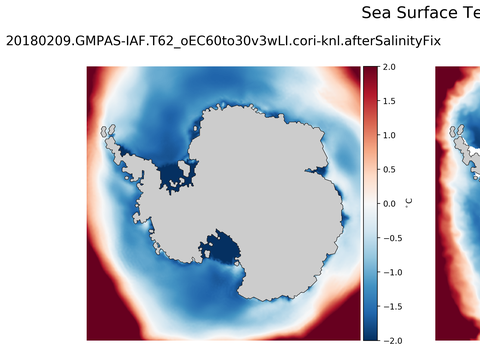
Antarctic Temperature
Antarctic Salinity
Global Argo Temperature
Global Argo Salinity
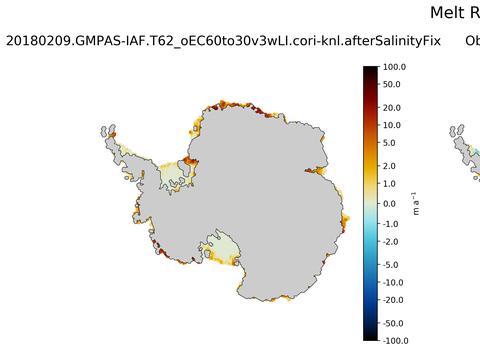
Antarctic Melt Rate

Antarctic Melt Time Series
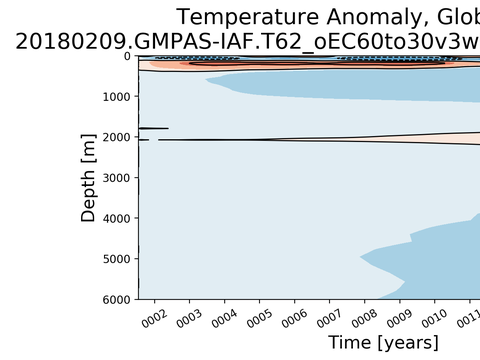
Trends vs Depth
Time Series
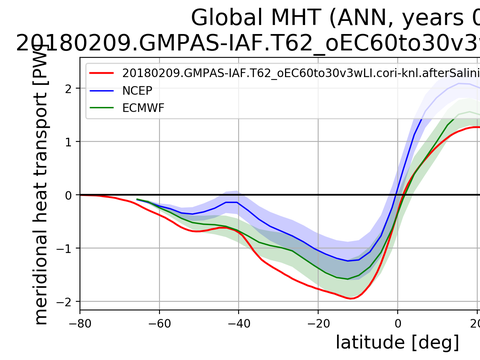
Meridional Heat Transport
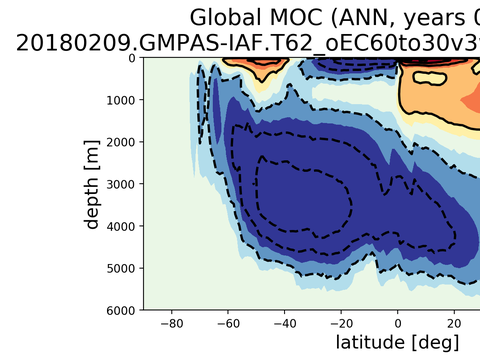
Meridional Overturning Streamfunction
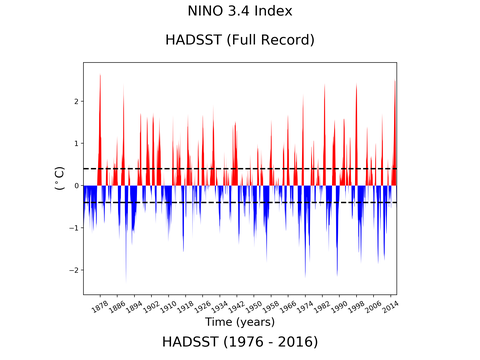
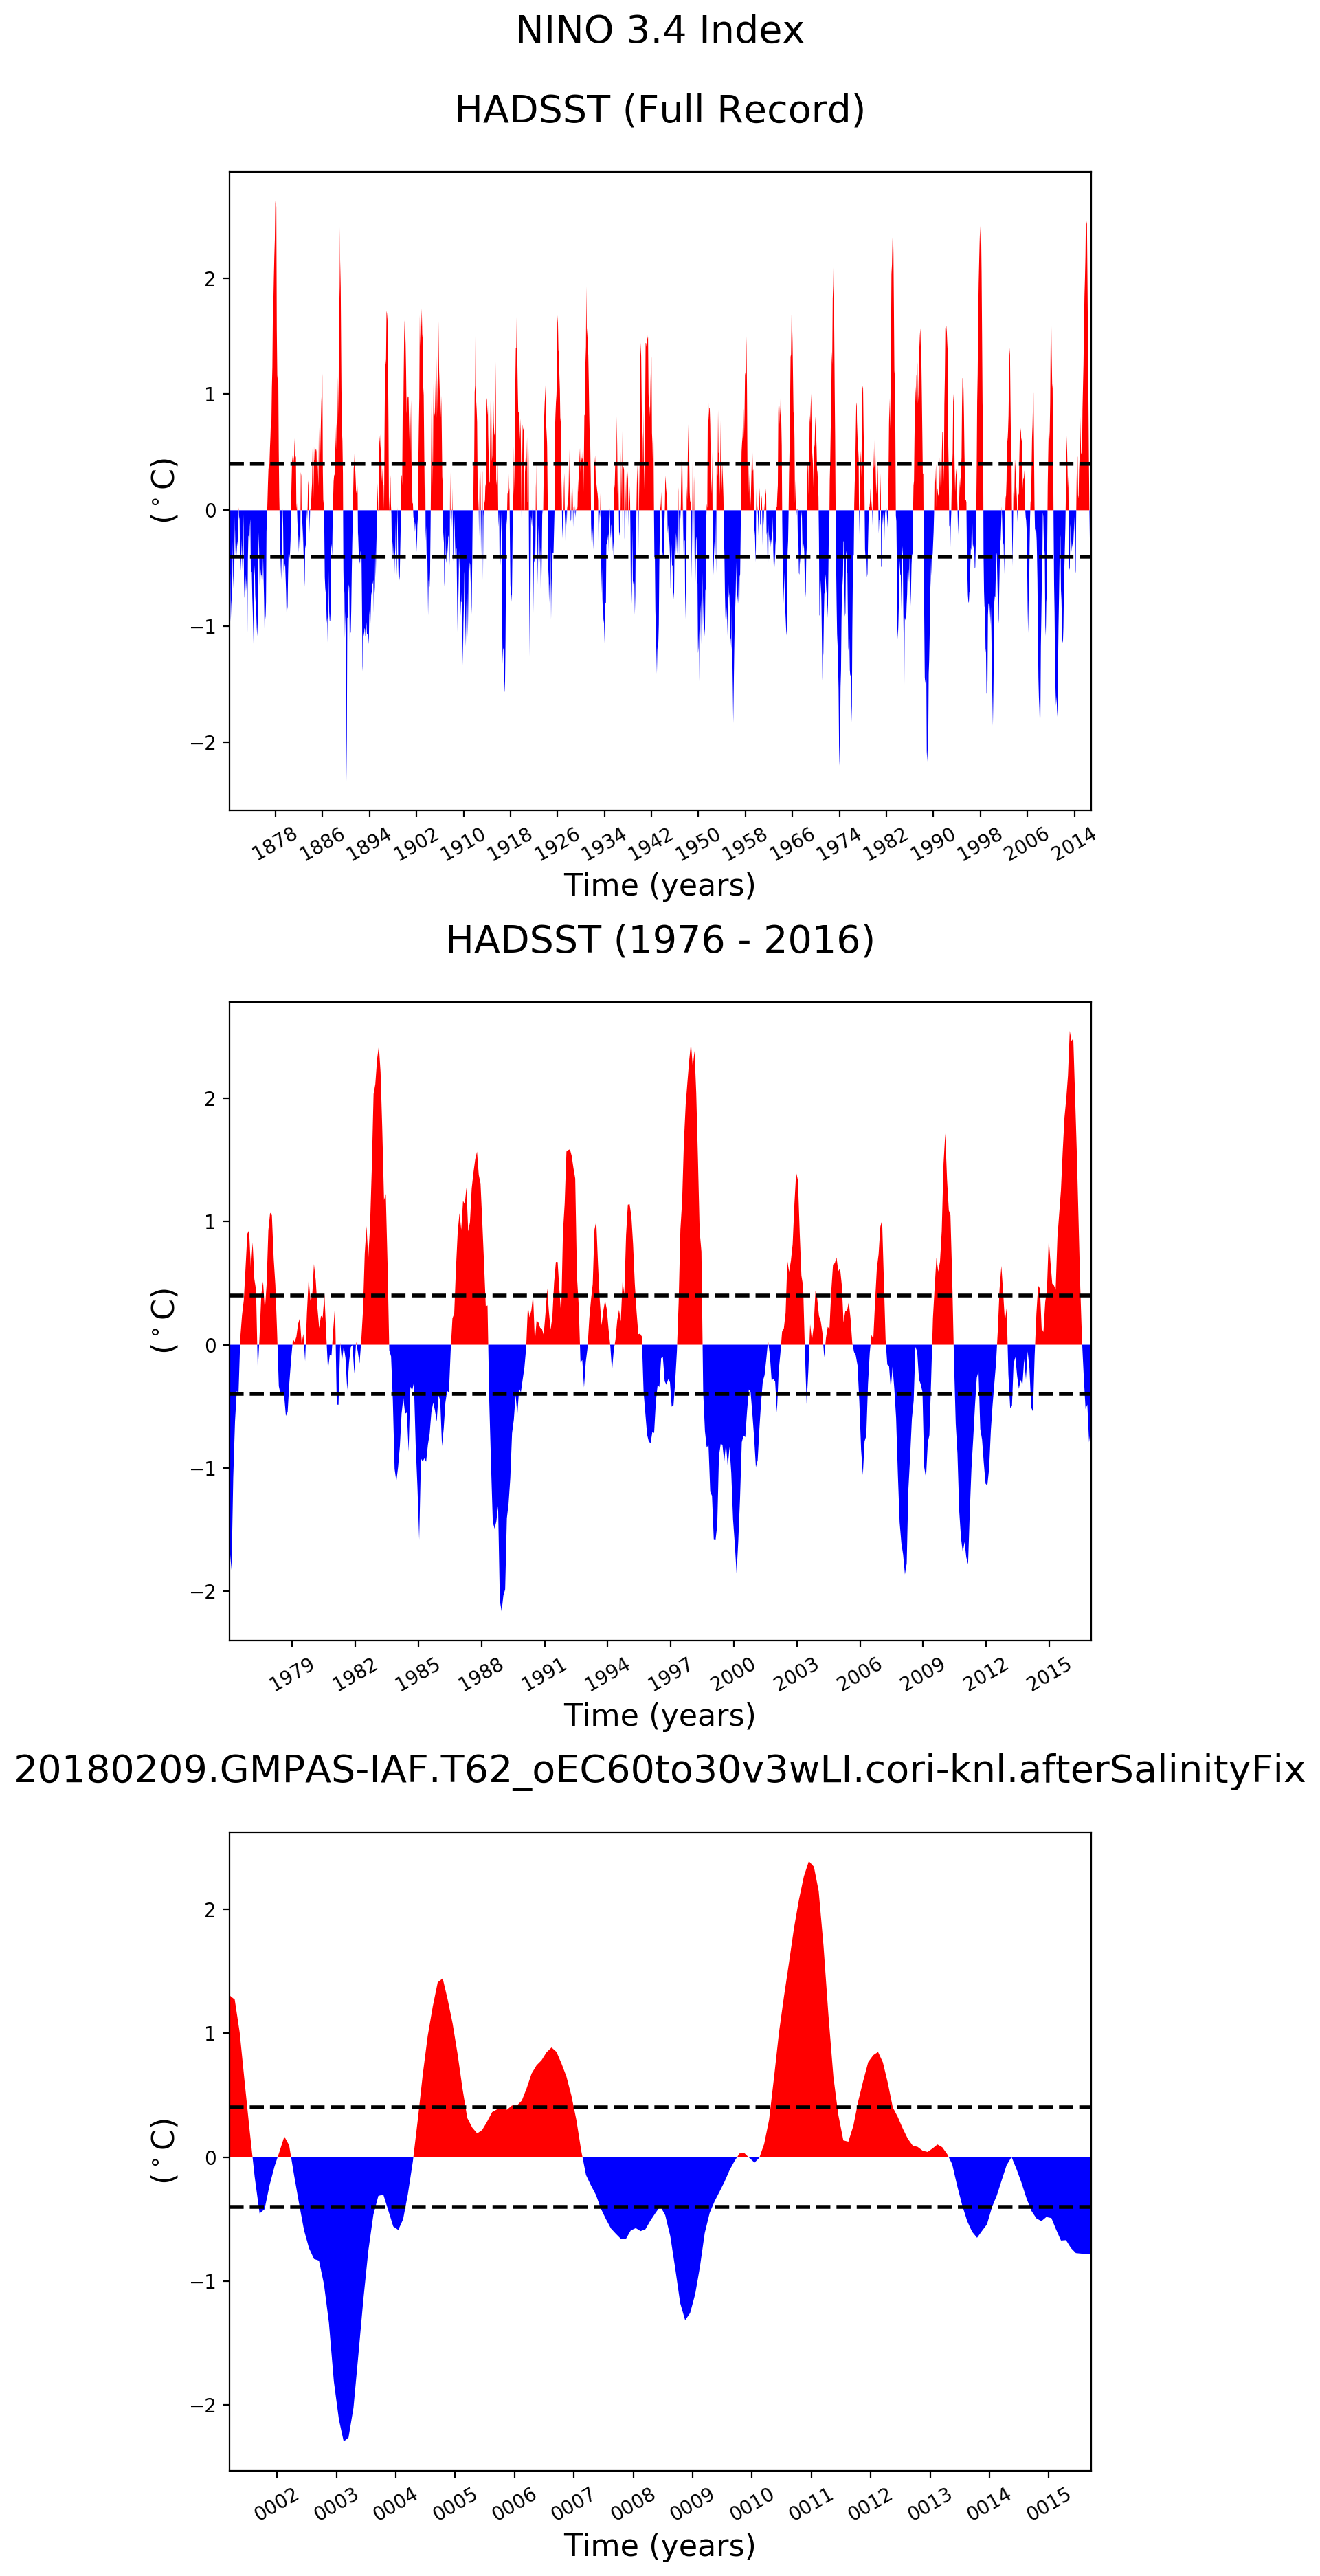
El Niño 3.4 Climate Index
Observations: Holte-Talley ARGO

JFM

JAS

ANN
Observations: Hadley-NOAA-OI

JFM

JAS

ANN
Observations: Aquarius

JFM

JAS

ANN
Observations: AVISO

JFM

JAS

ANN
State Estimate: SOSE

ANN surface

ANN z=-200 m

ANN z=-400 m

ANN z=-600 m

ANN z=-800 m

ANN floor

JFM surface

JFM z=-200 m

JFM z=-400 m

JFM z=-600 m

JFM z=-800 m

JFM floor

JAS surface

JAS z=-200 m

JAS z=-400 m

JAS z=-600 m

JAS z=-800 m

JAS floor
State Estimate: SOSE

ANN surface

ANN z=-200 m

ANN z=-400 m

ANN z=-600 m

ANN z=-800 m

ANN floor

JFM surface

JFM z=-200 m

JFM z=-400 m

JFM z=-600 m

JFM z=-800 m

JFM floor

JAS surface

JAS z=-200 m

JAS z=-400 m

JAS z=-600 m

JAS z=-800 m

JAS floor
Roemmich-Gilson Climatology: ARGO

ANN surface

ANN z=-25 m

ANN z=-50 m

ANN z=-100 m

ANN z=-150 m

ANN z=-200 m

ANN z=-400 m

ANN z=-800 m

ANN z=-1500 m

JAS surface

JAS z=-25 m

JAS z=-50 m

JAS z=-100 m

JAS z=-150 m

JAS z=-200 m

JAS z=-400 m

JAS z=-800 m

JAS z=-1500 m

JFM surface

JFM z=-25 m

JFM z=-50 m

JFM z=-100 m

JFM z=-150 m

JFM z=-200 m

JFM z=-400 m

JFM z=-800 m

JFM z=-1500 m
Roemmich-Gilson Climatology: Argo

ANN surface

ANN z=-25 m

ANN z=-50 m

ANN z=-100 m

ANN z=-150 m

ANN z=-200 m

ANN z=-400 m

ANN z=-600 m

ANN z=-800 m

ANN z=-1500 m

JFM surface

JFM z=-25 m

JFM z=-50 m

JFM z=-100 m

JFM z=-150 m

JFM z=-200 m

JFM z=-400 m

JFM z=-600 m

JFM z=-800 m

JFM z=-1500 m

JAS surface

JAS z=-25 m

JAS z=-50 m

JAS z=-100 m

JAS z=-150 m

JAS z=-200 m

JAS z=-400 m

JAS z=-600 m

JAS z=-800 m

JAS z=-1500 m
Observations: Rignot et al. (2013)

JFM

JAS

ANN
Total Melt Flux
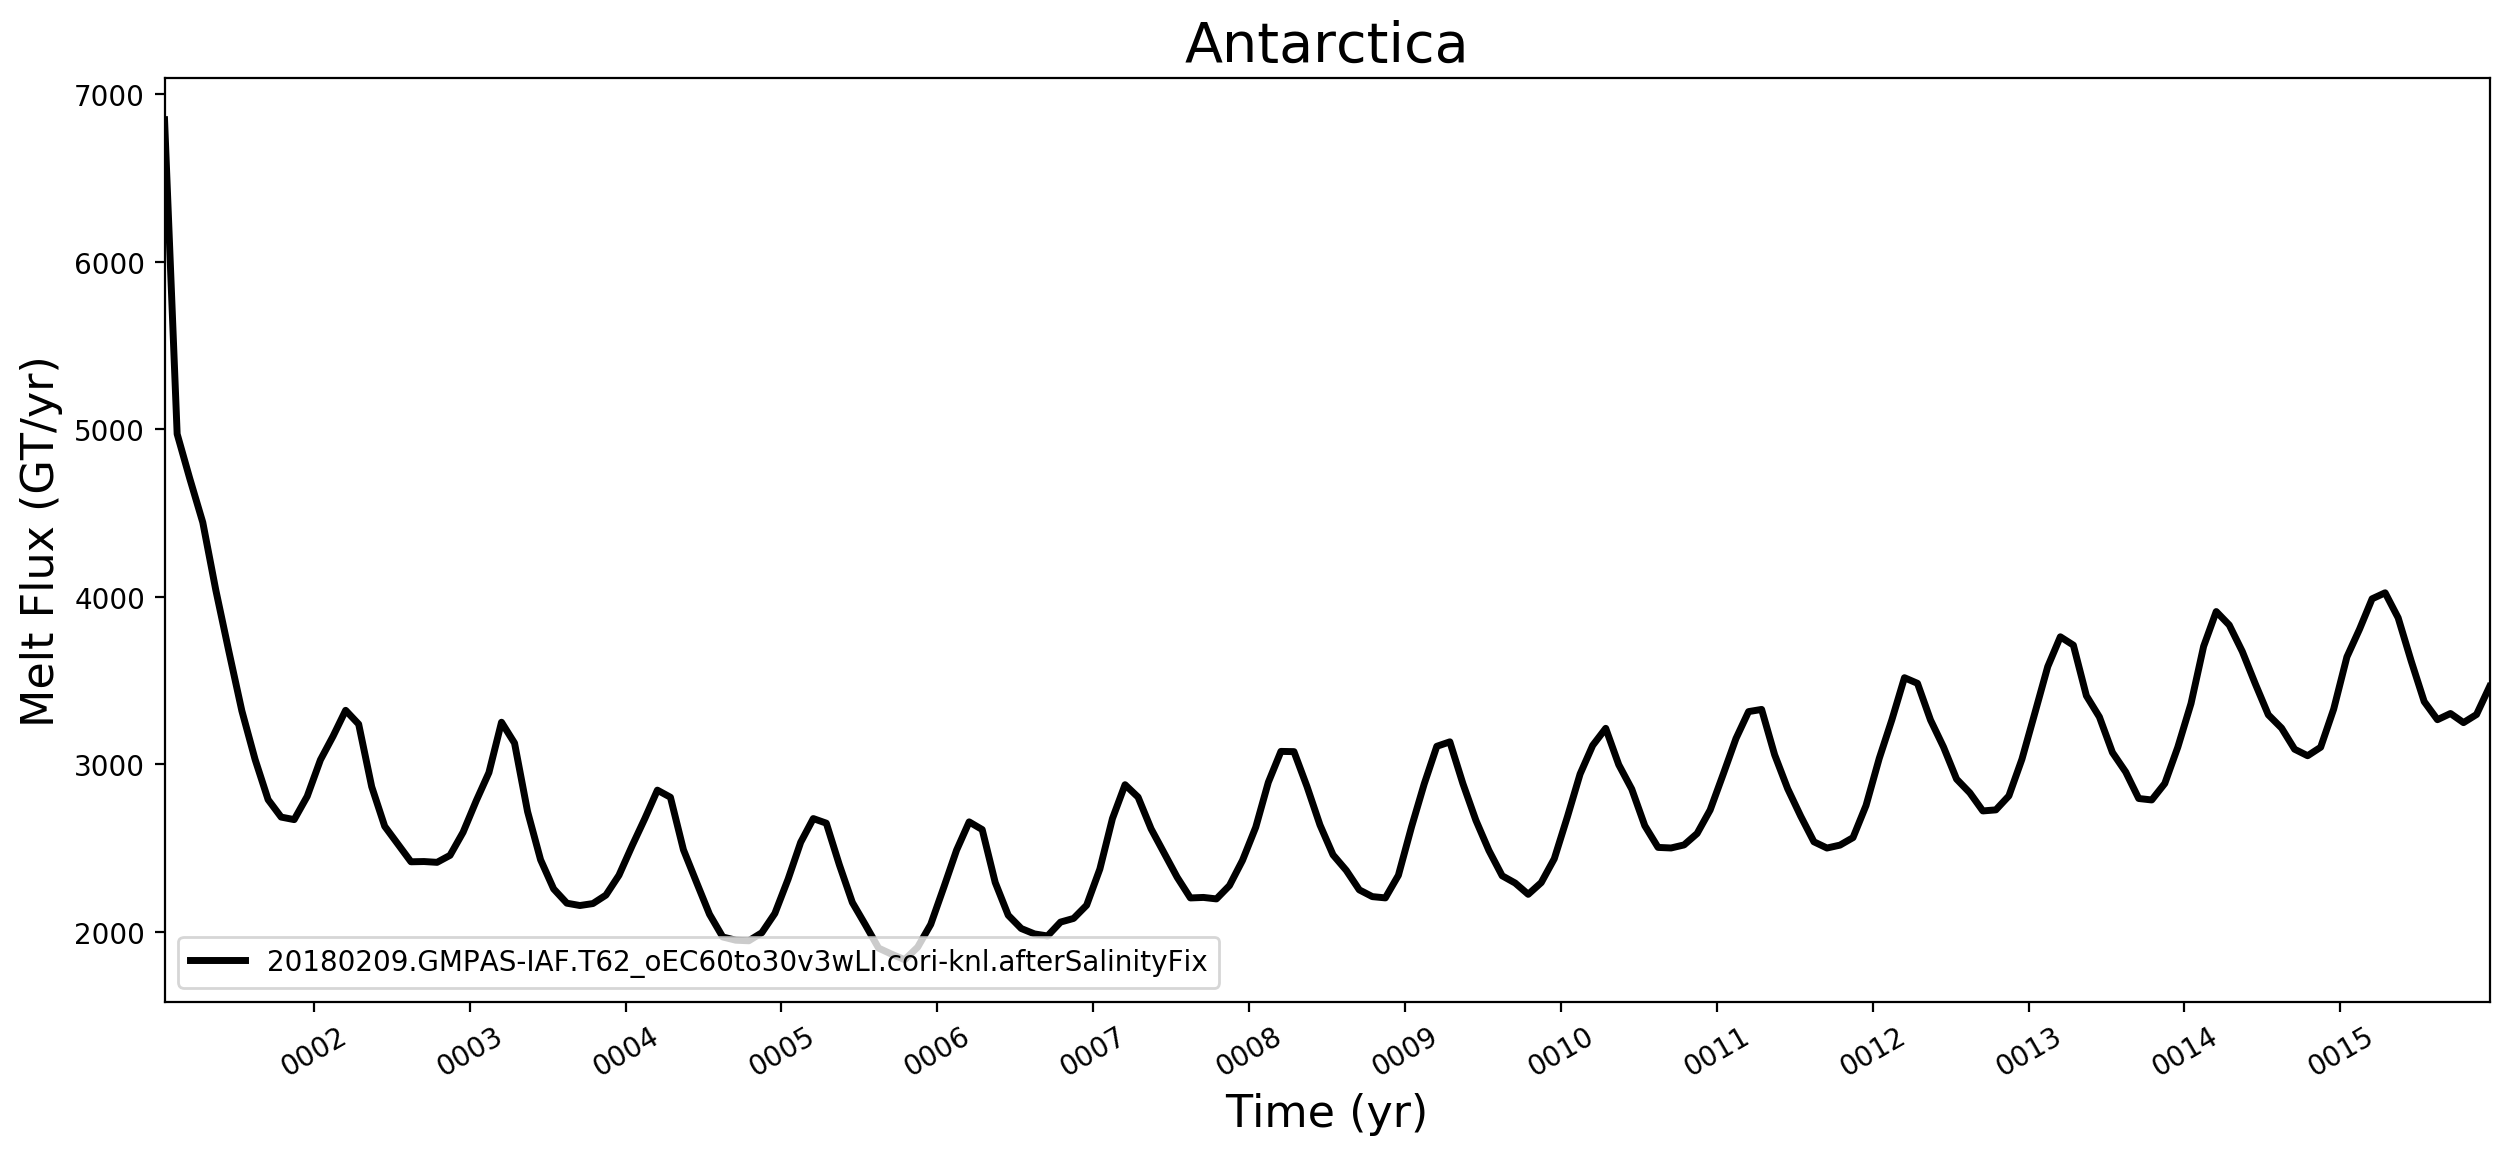
Antarctica
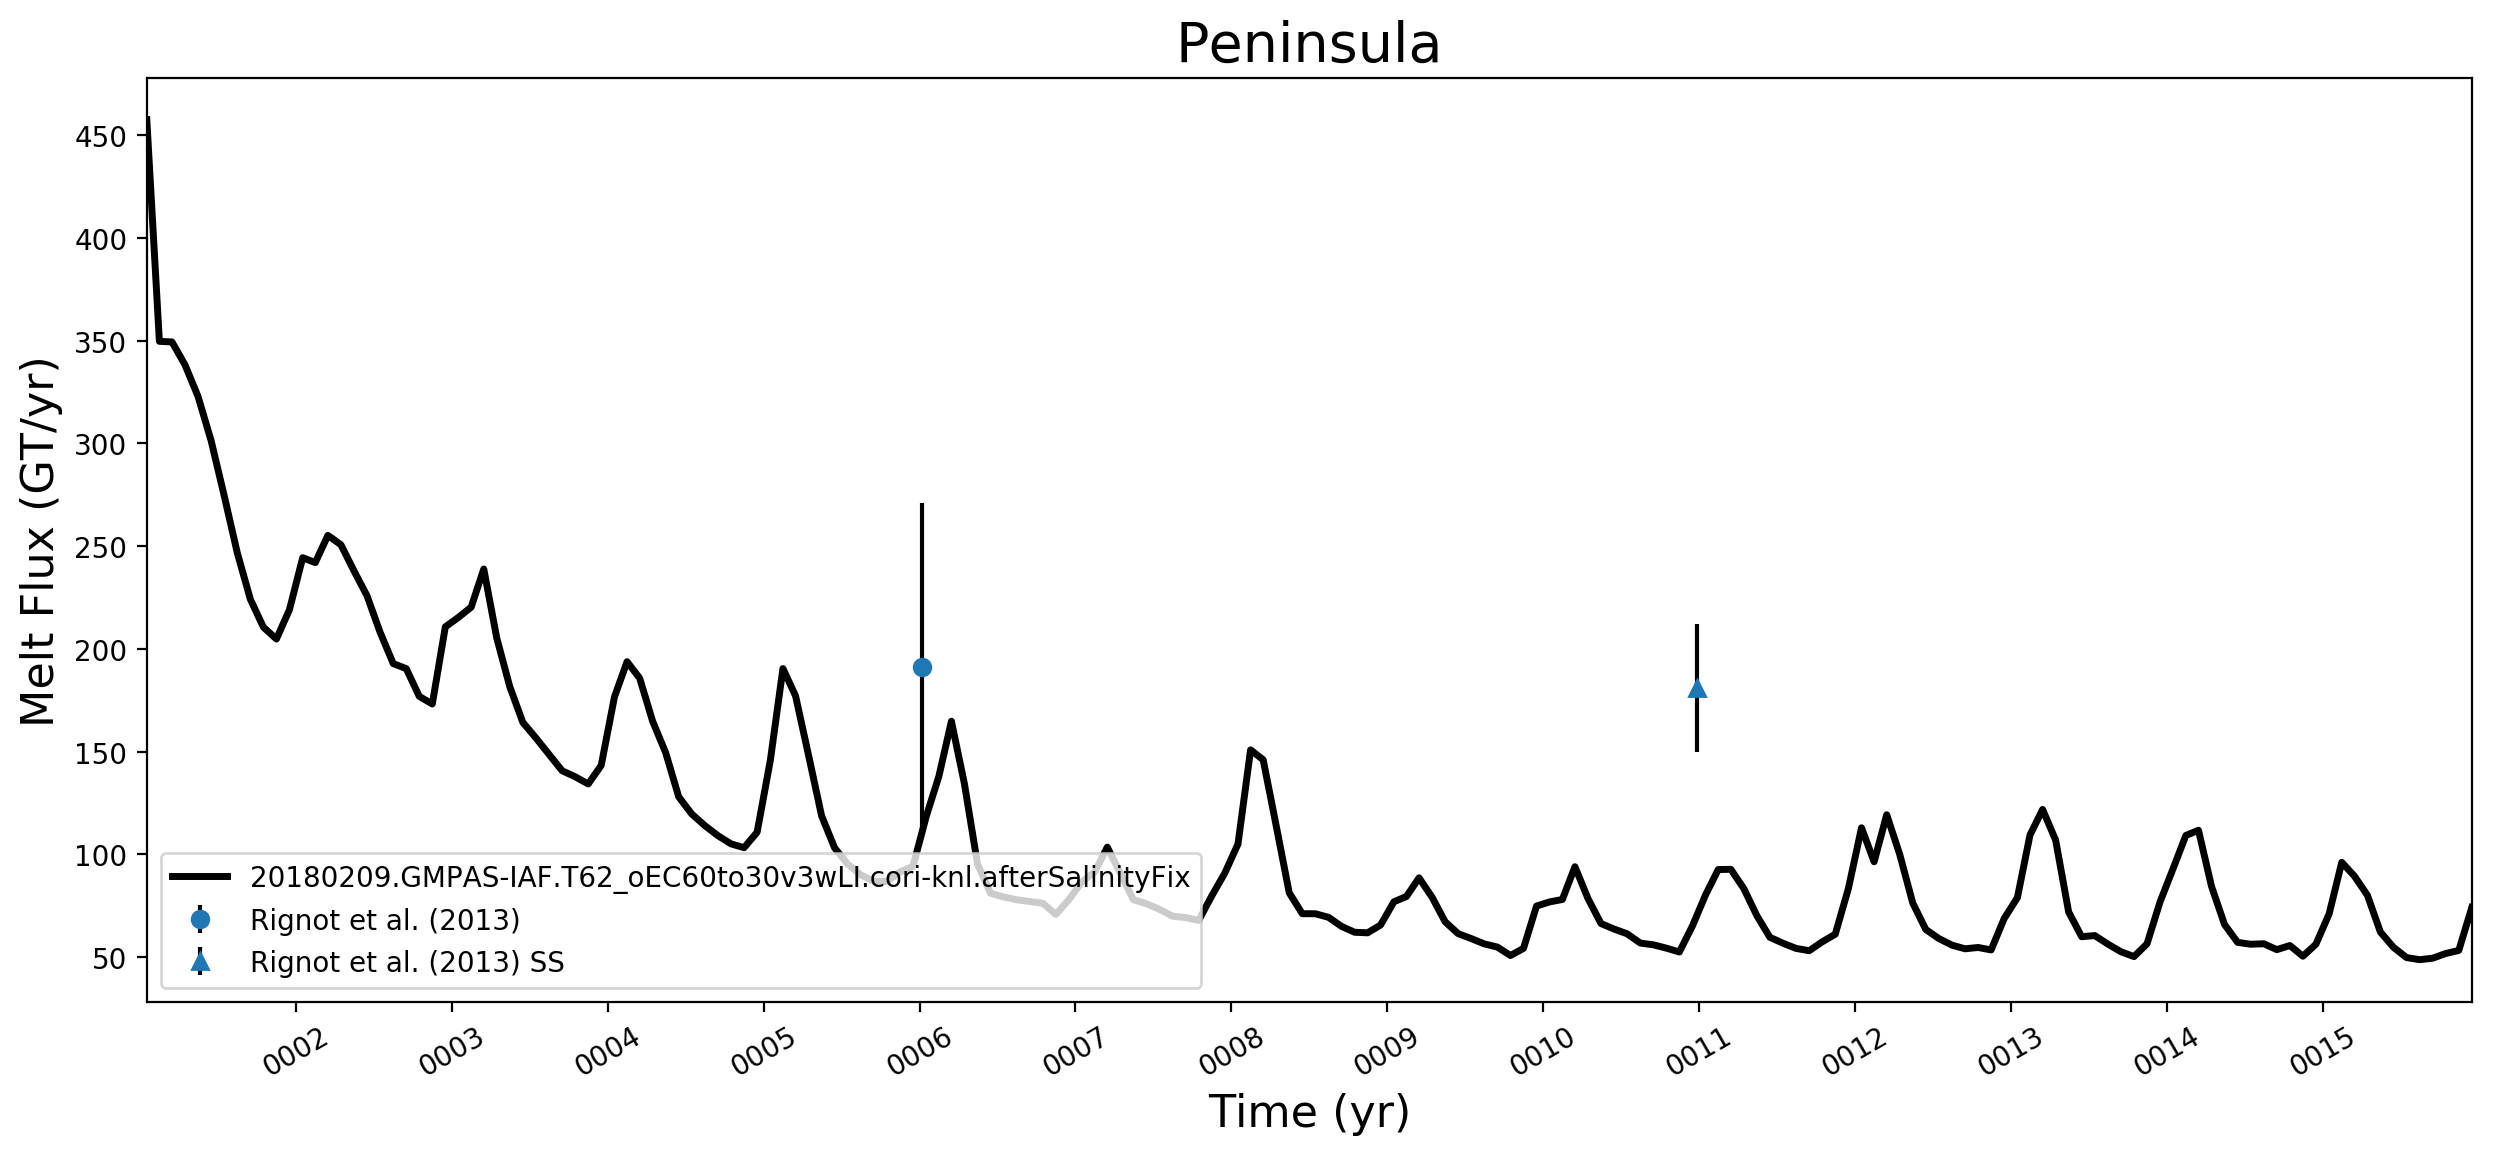
Peninsula
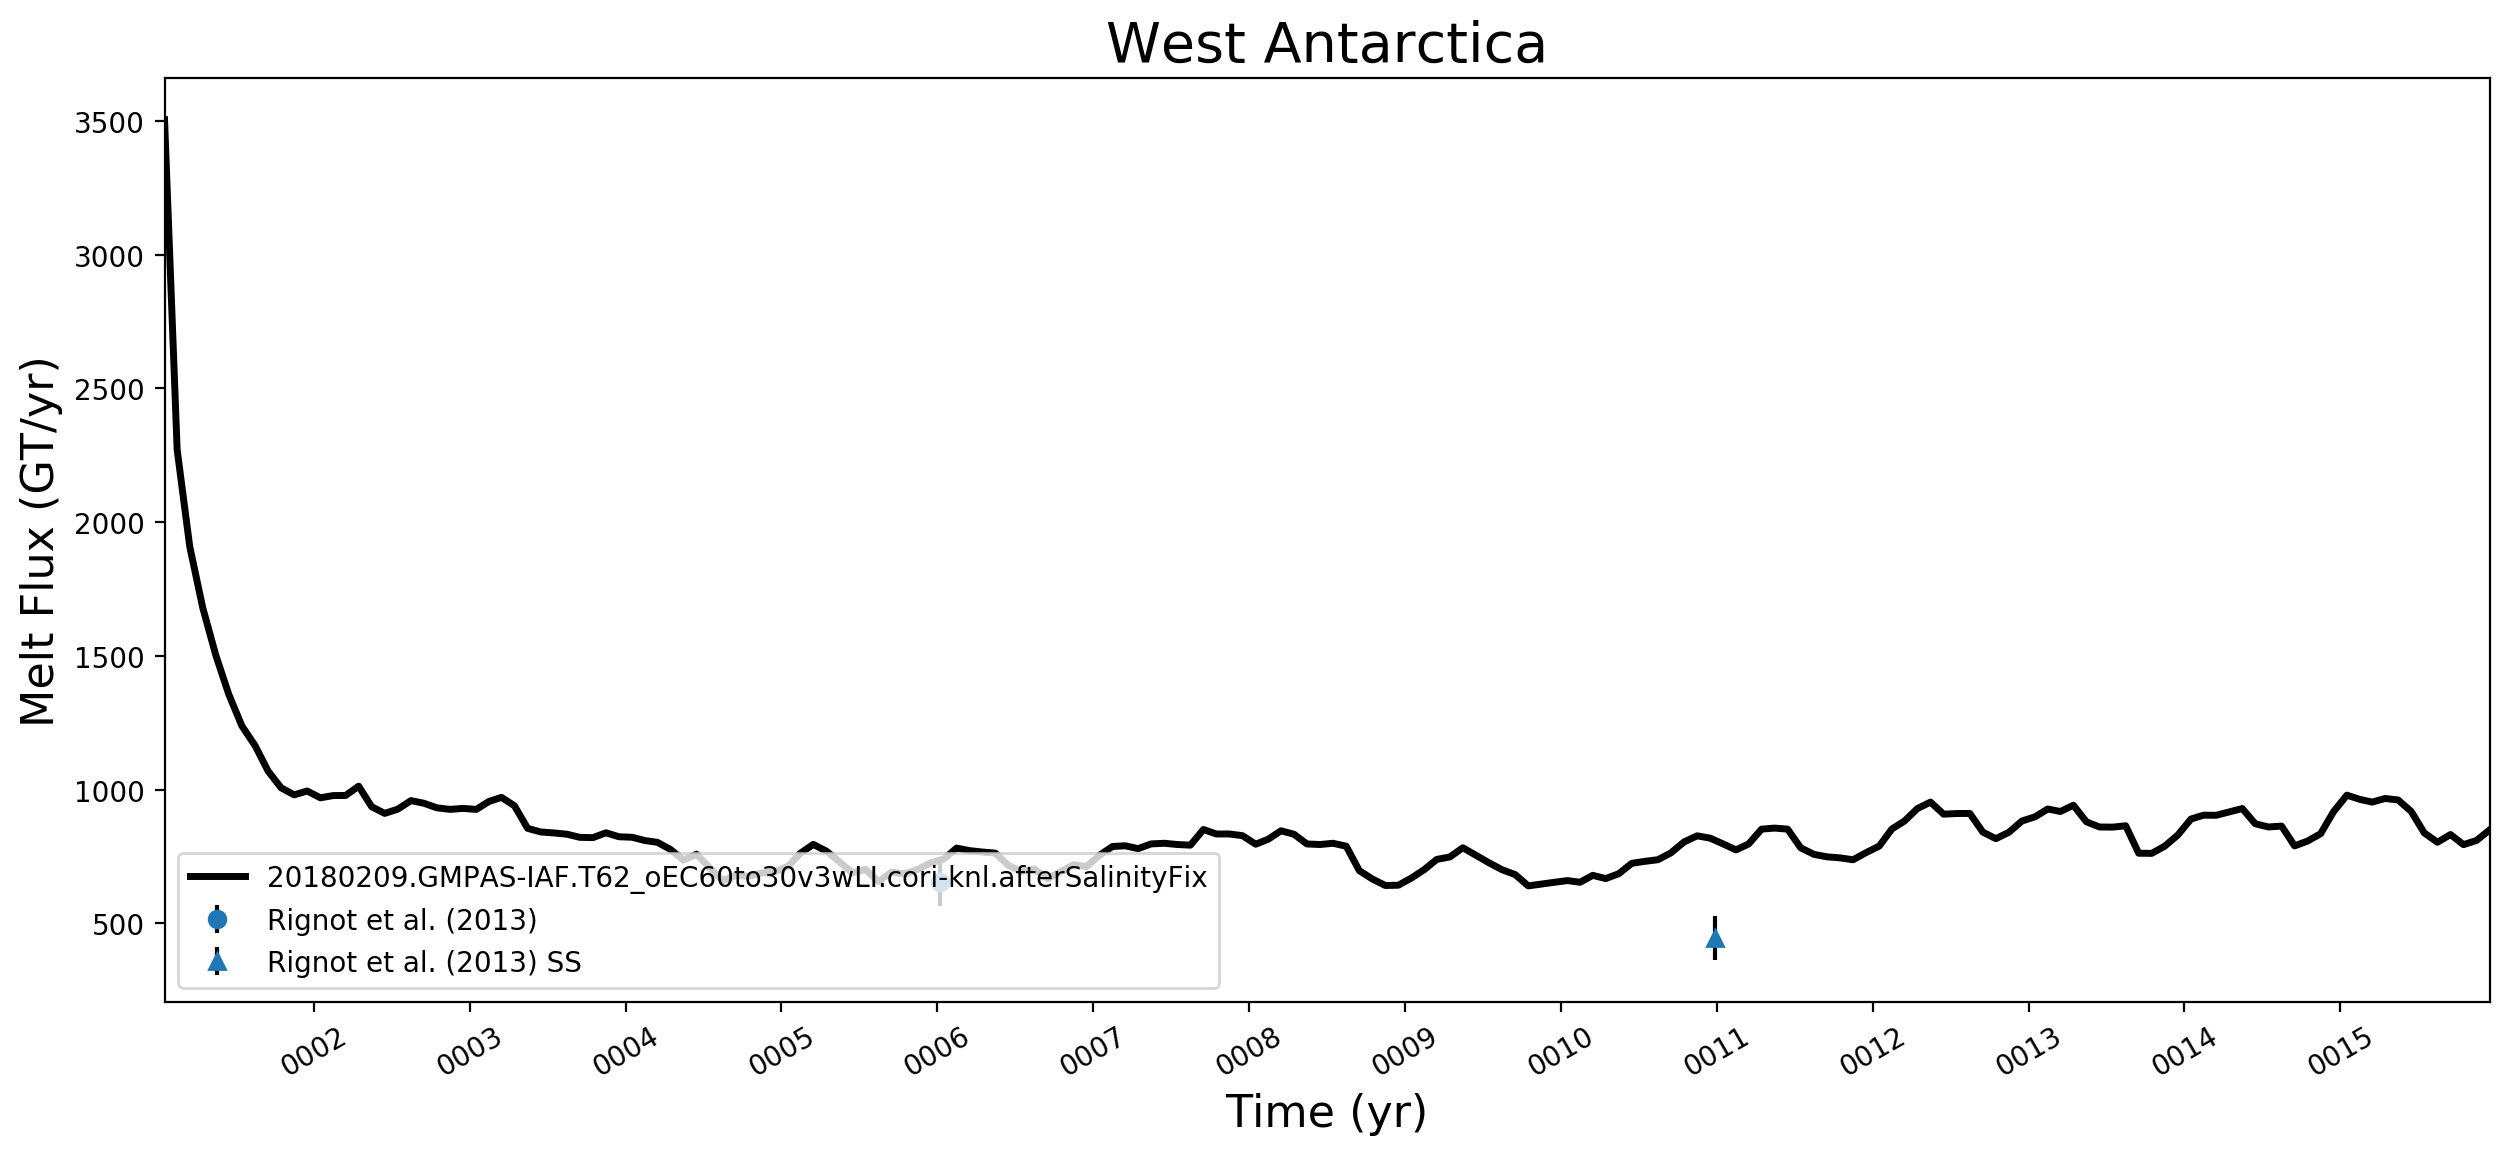
West Antarctica
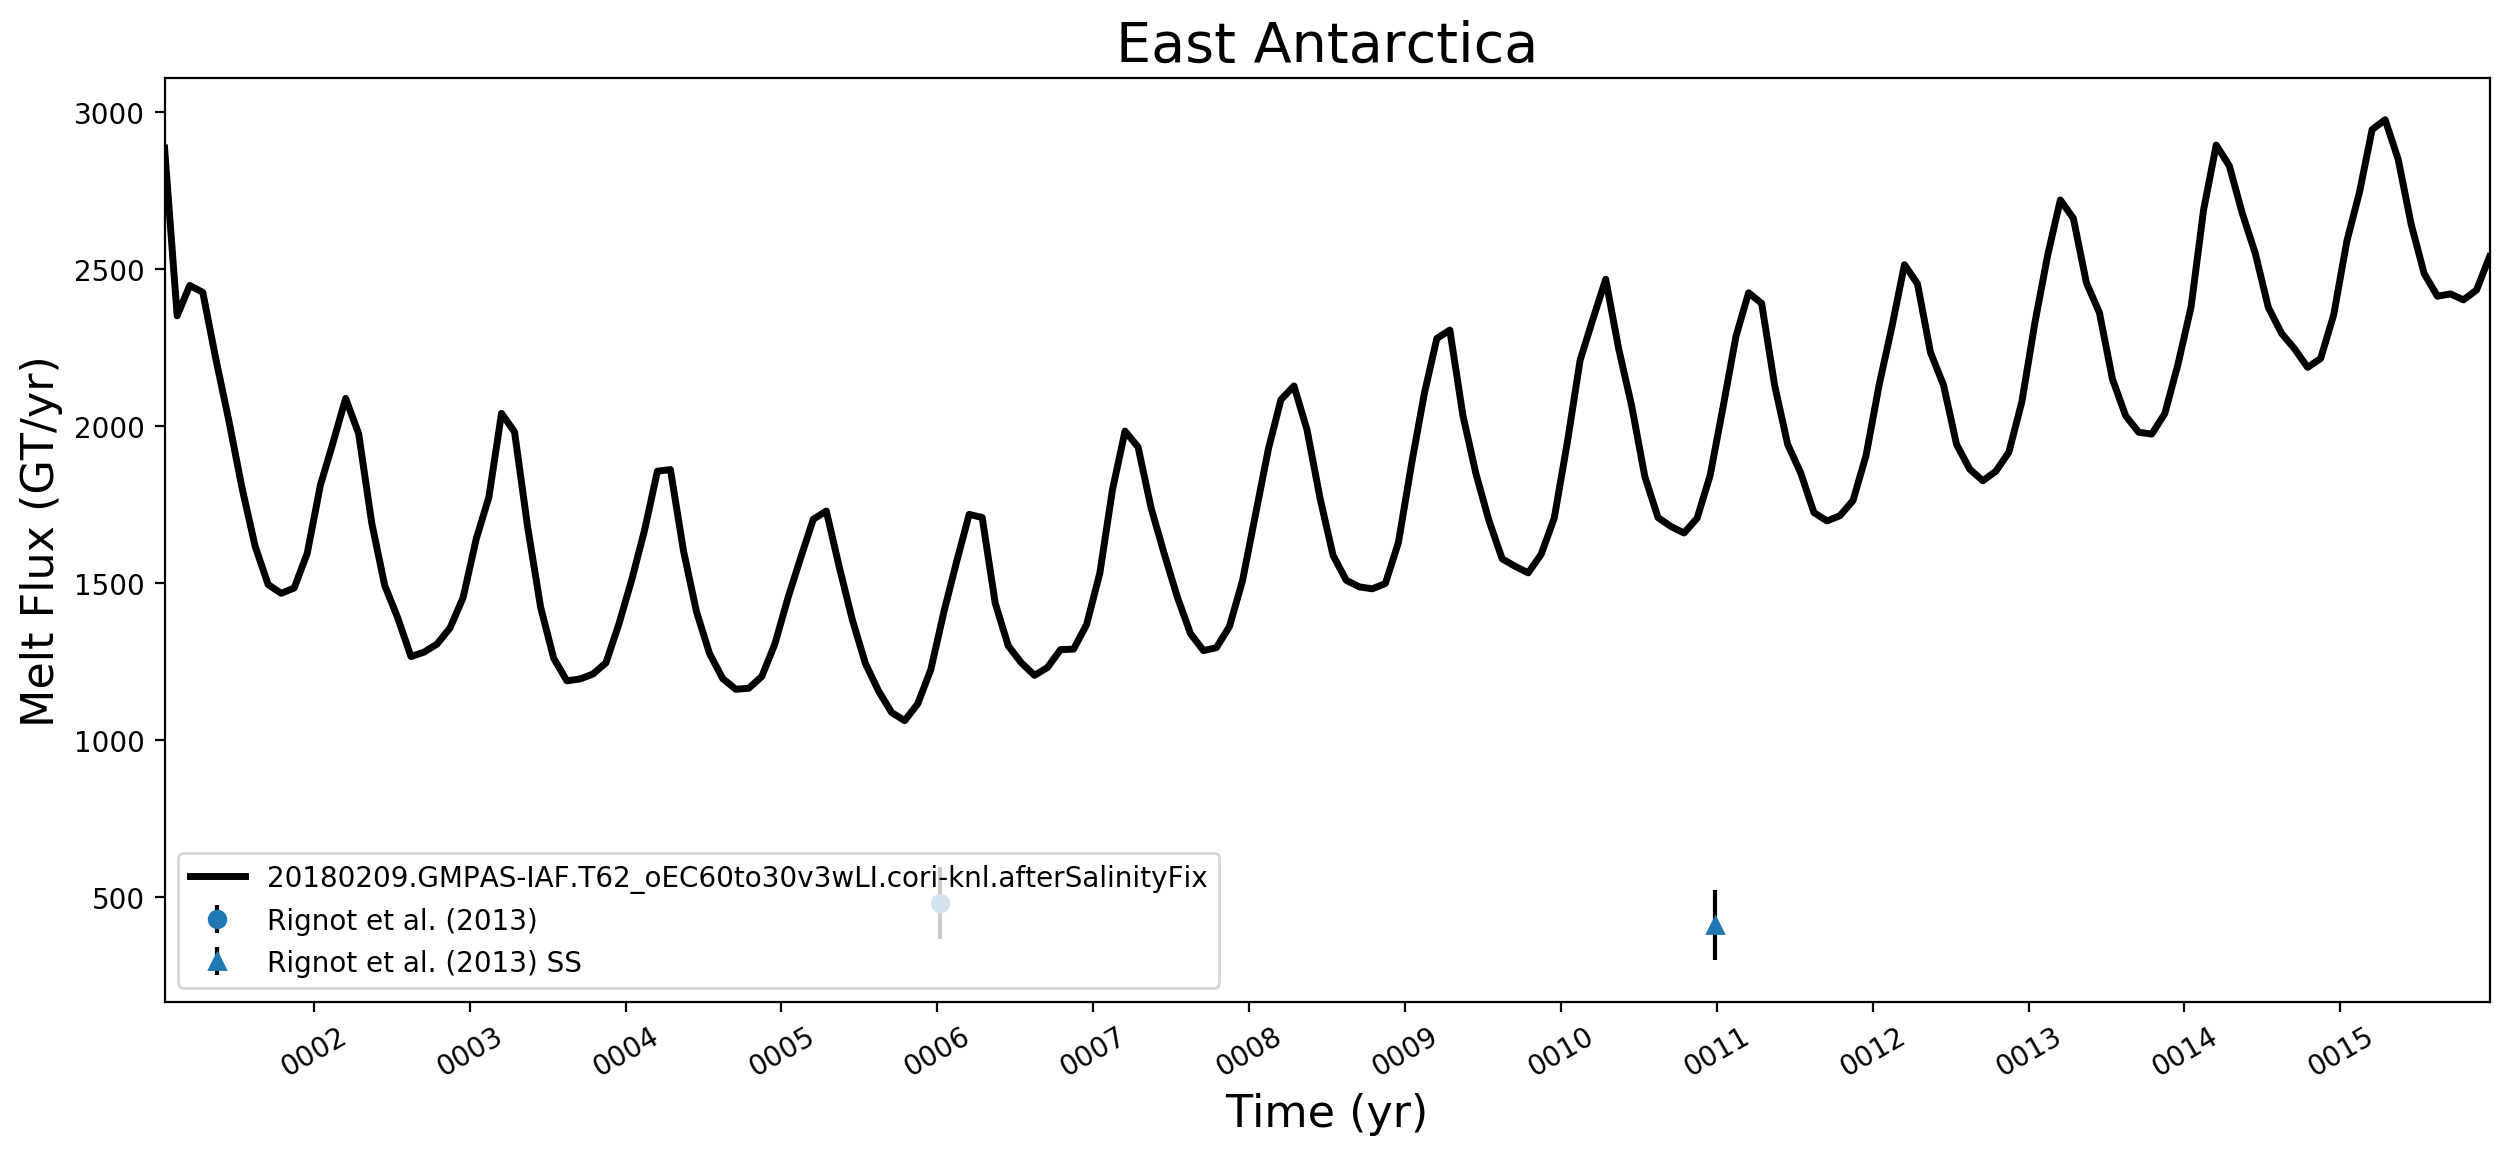
East Antarctica
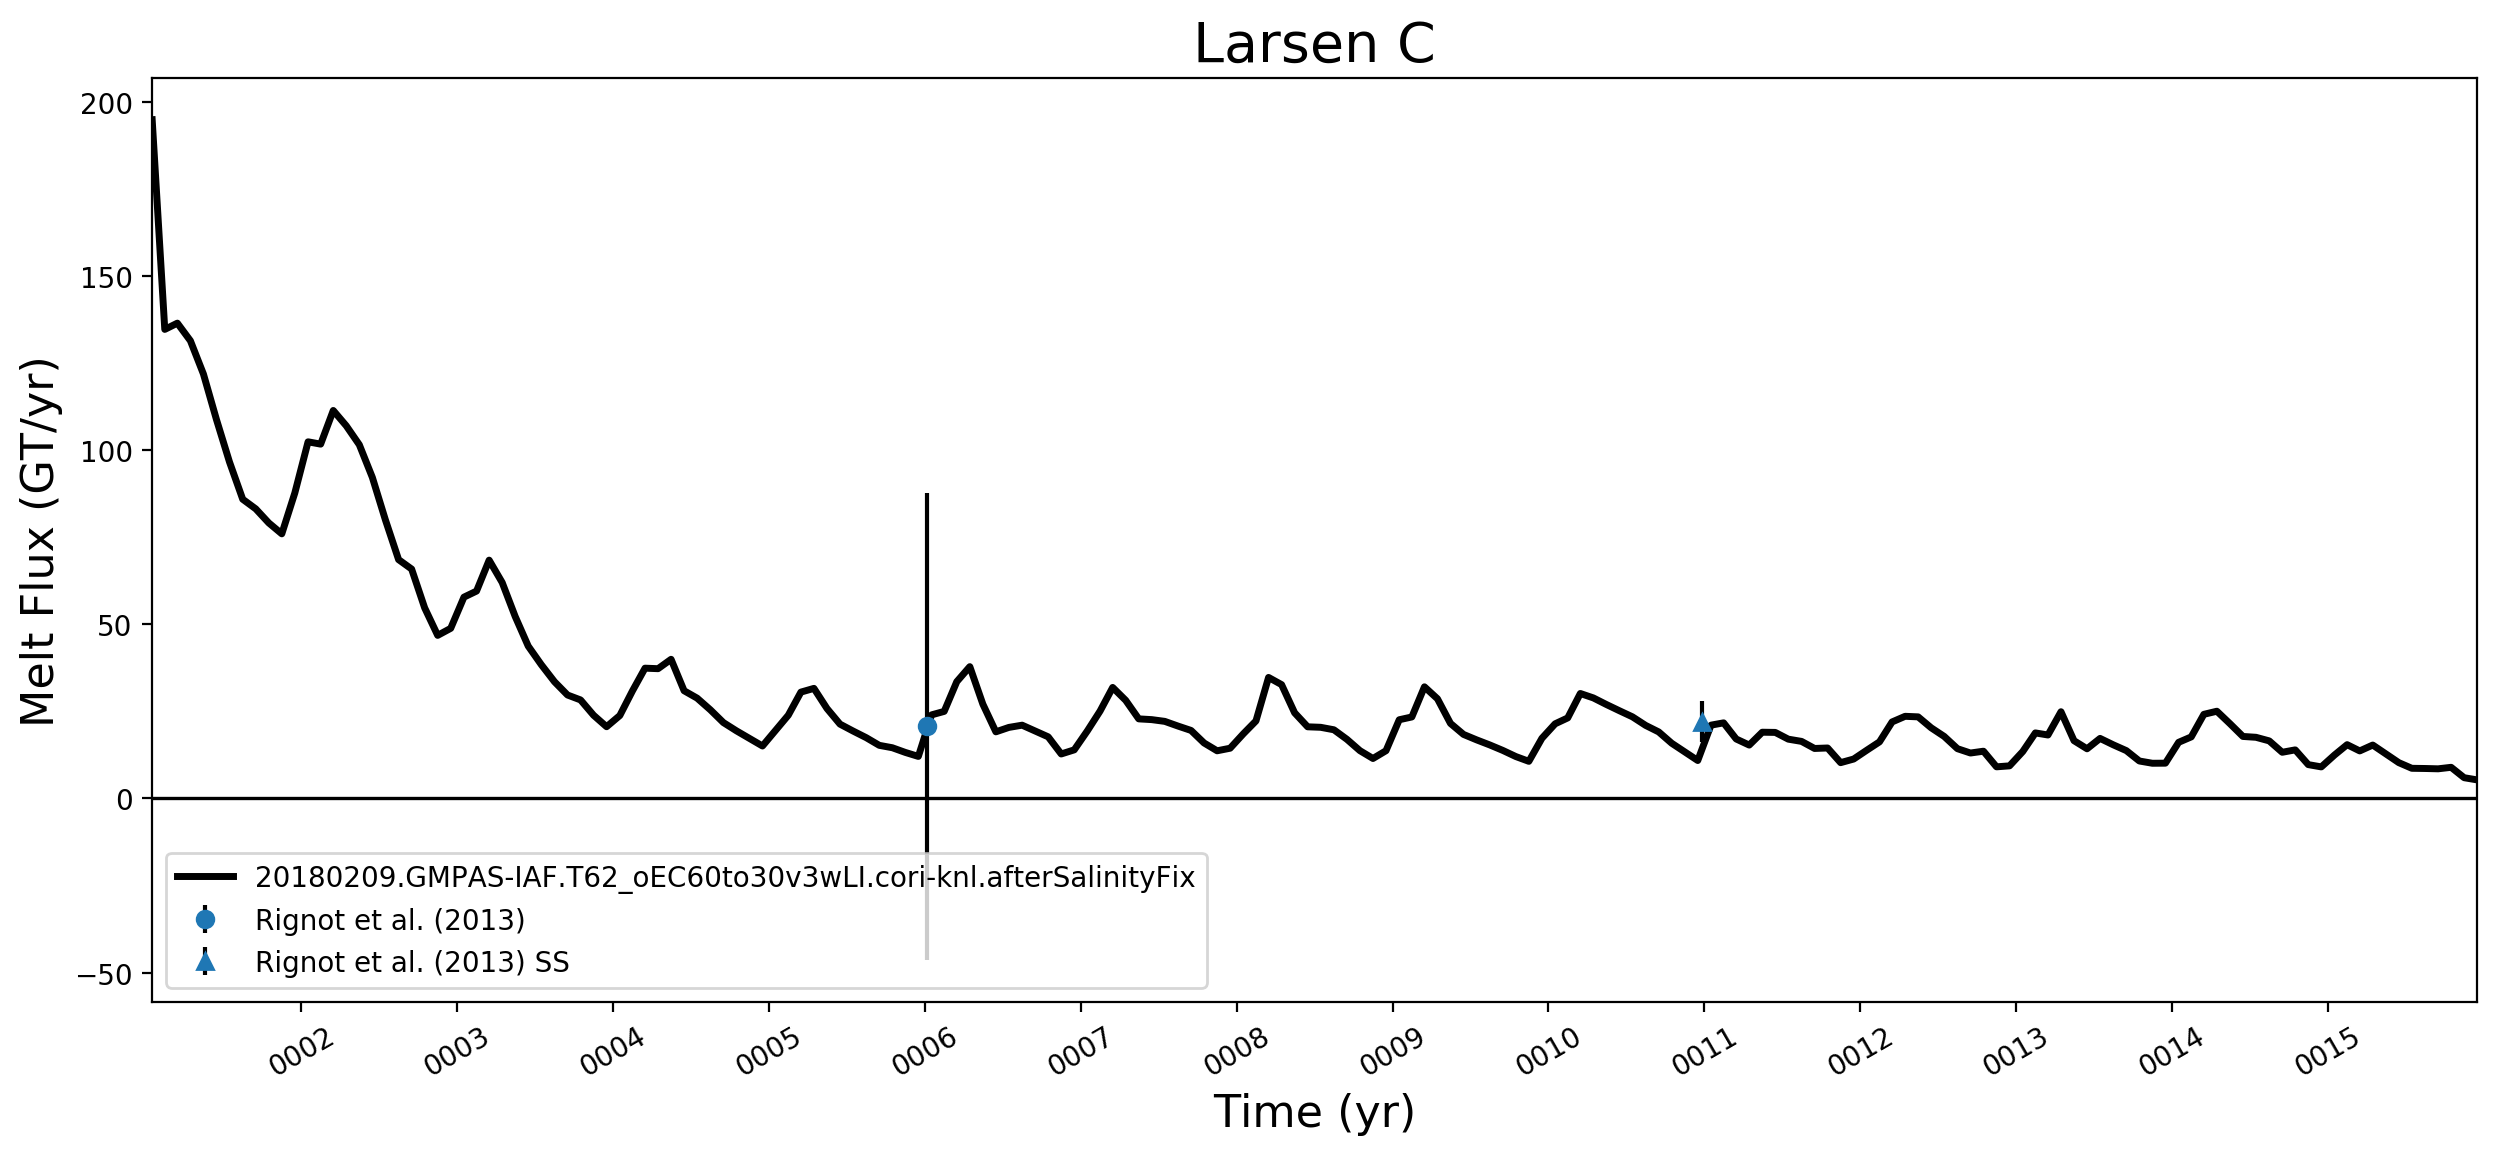
Larsen C
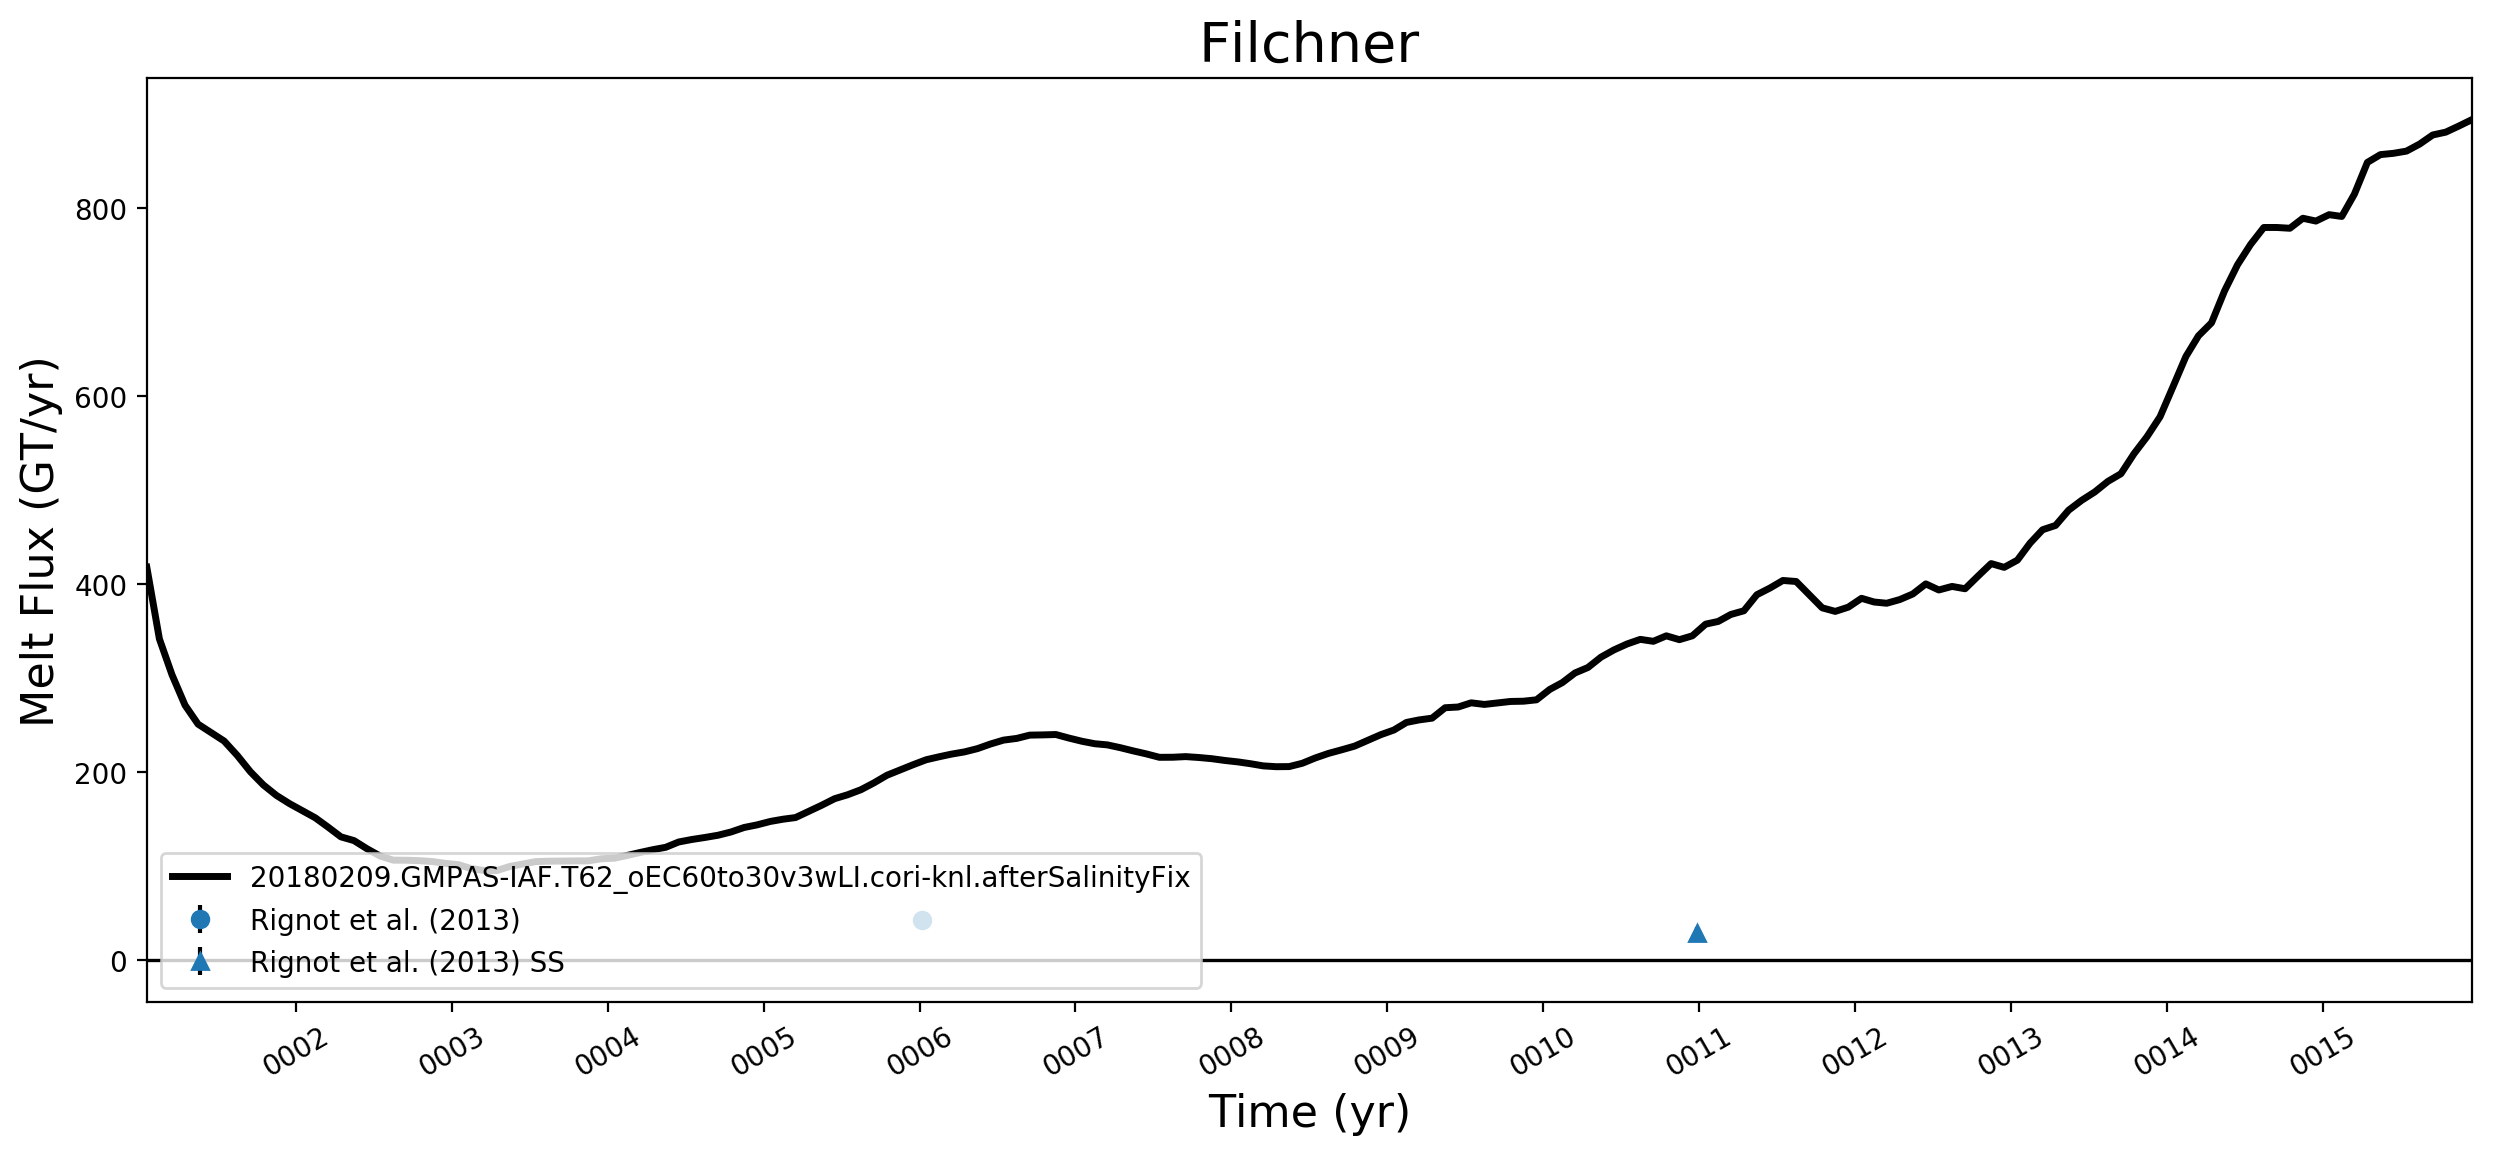
Filchner
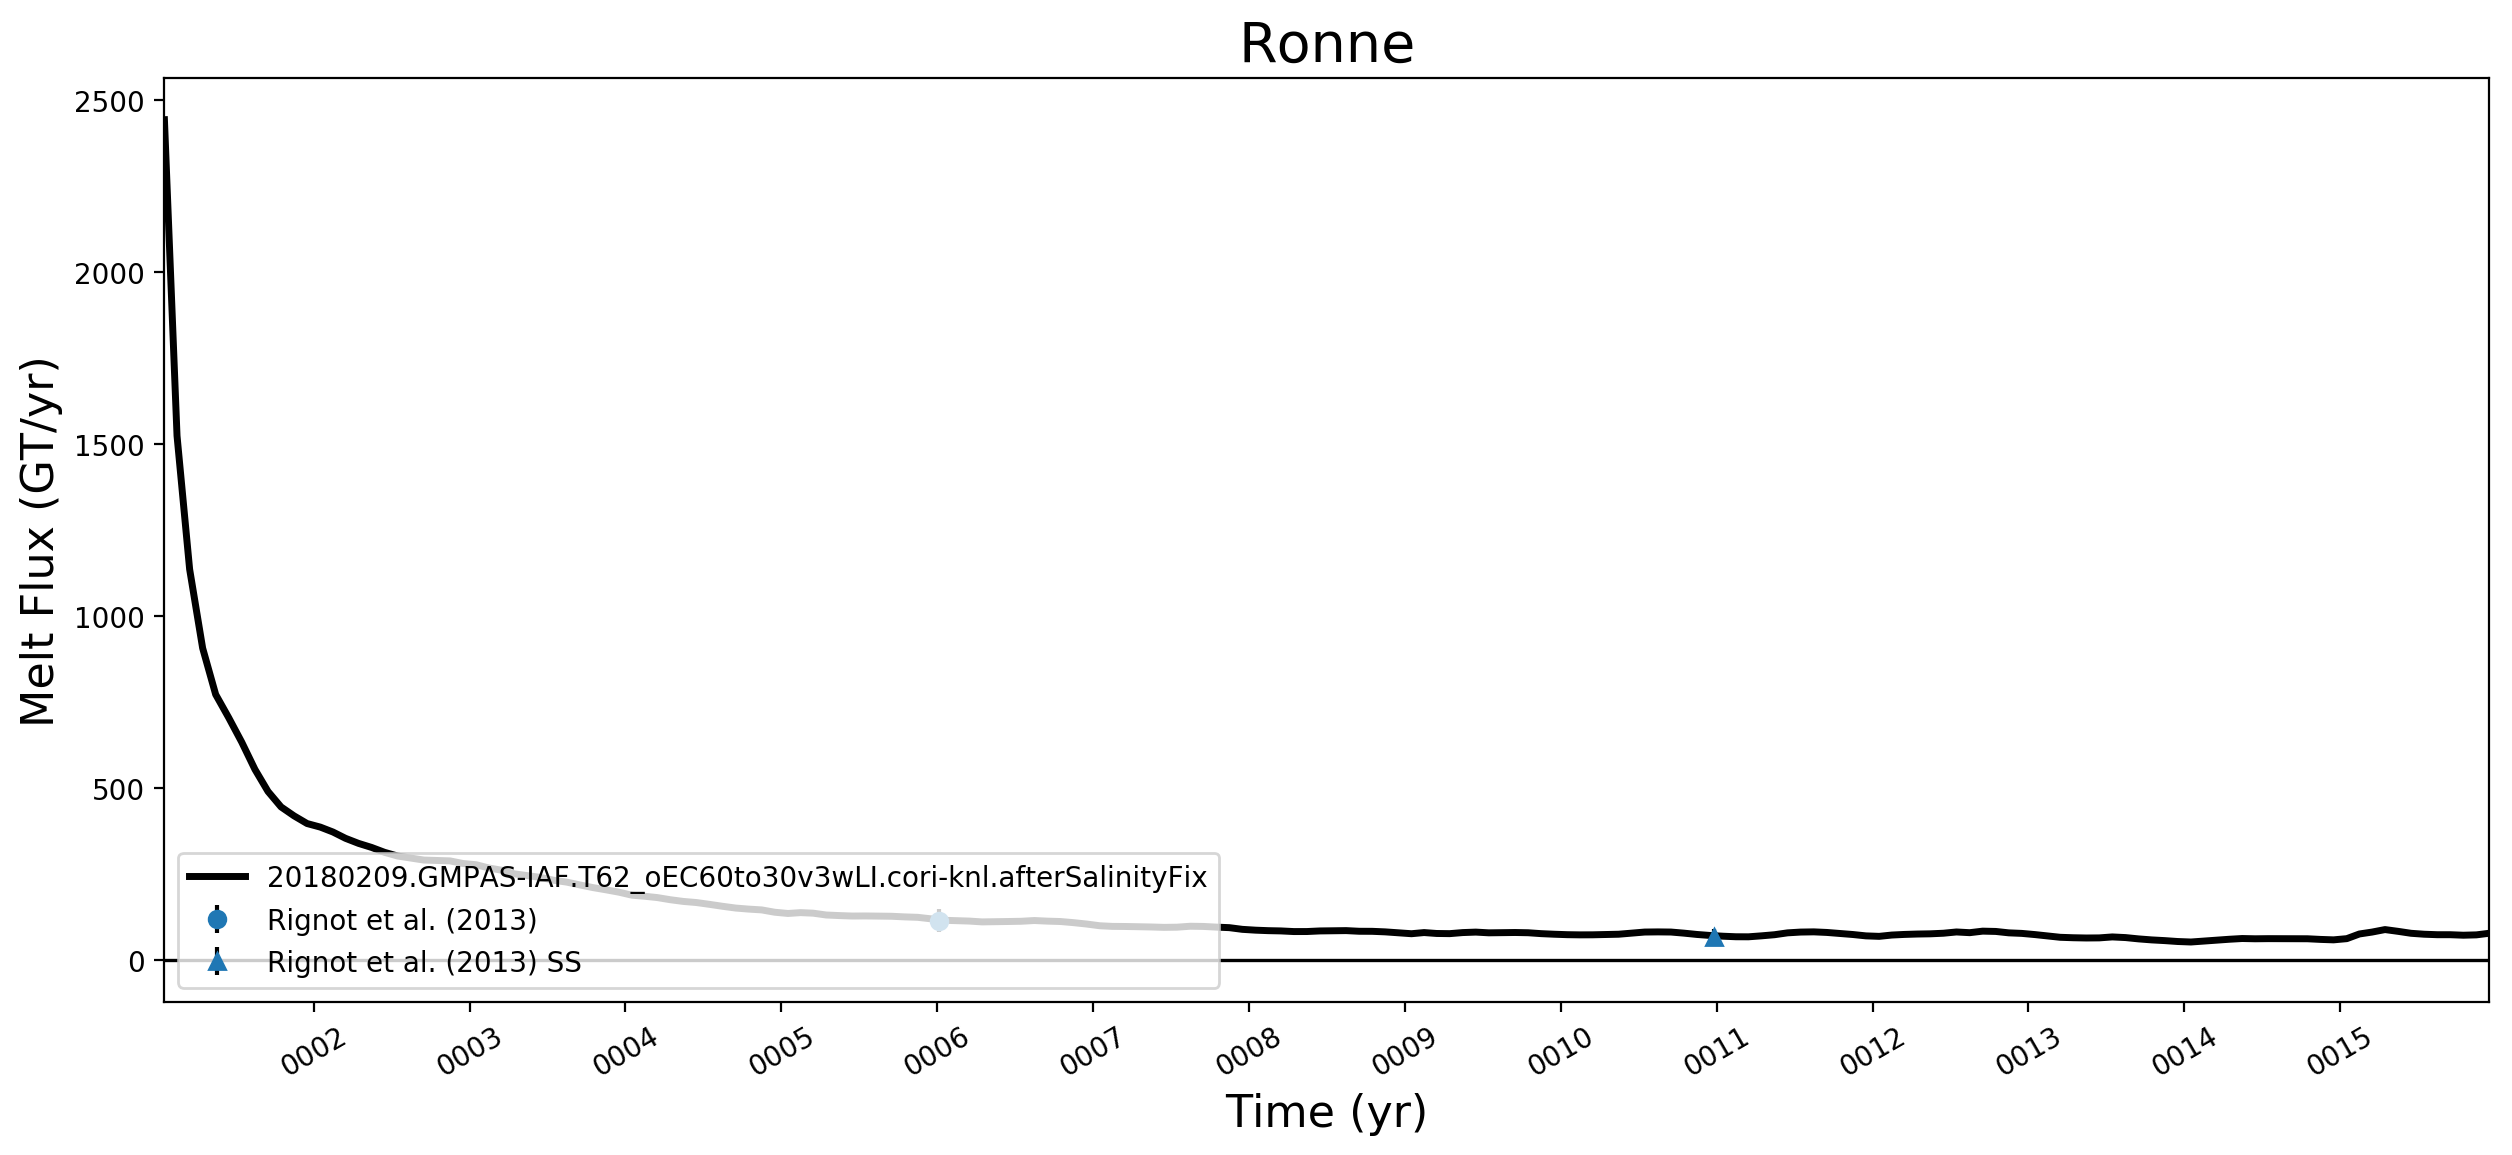
Ronne
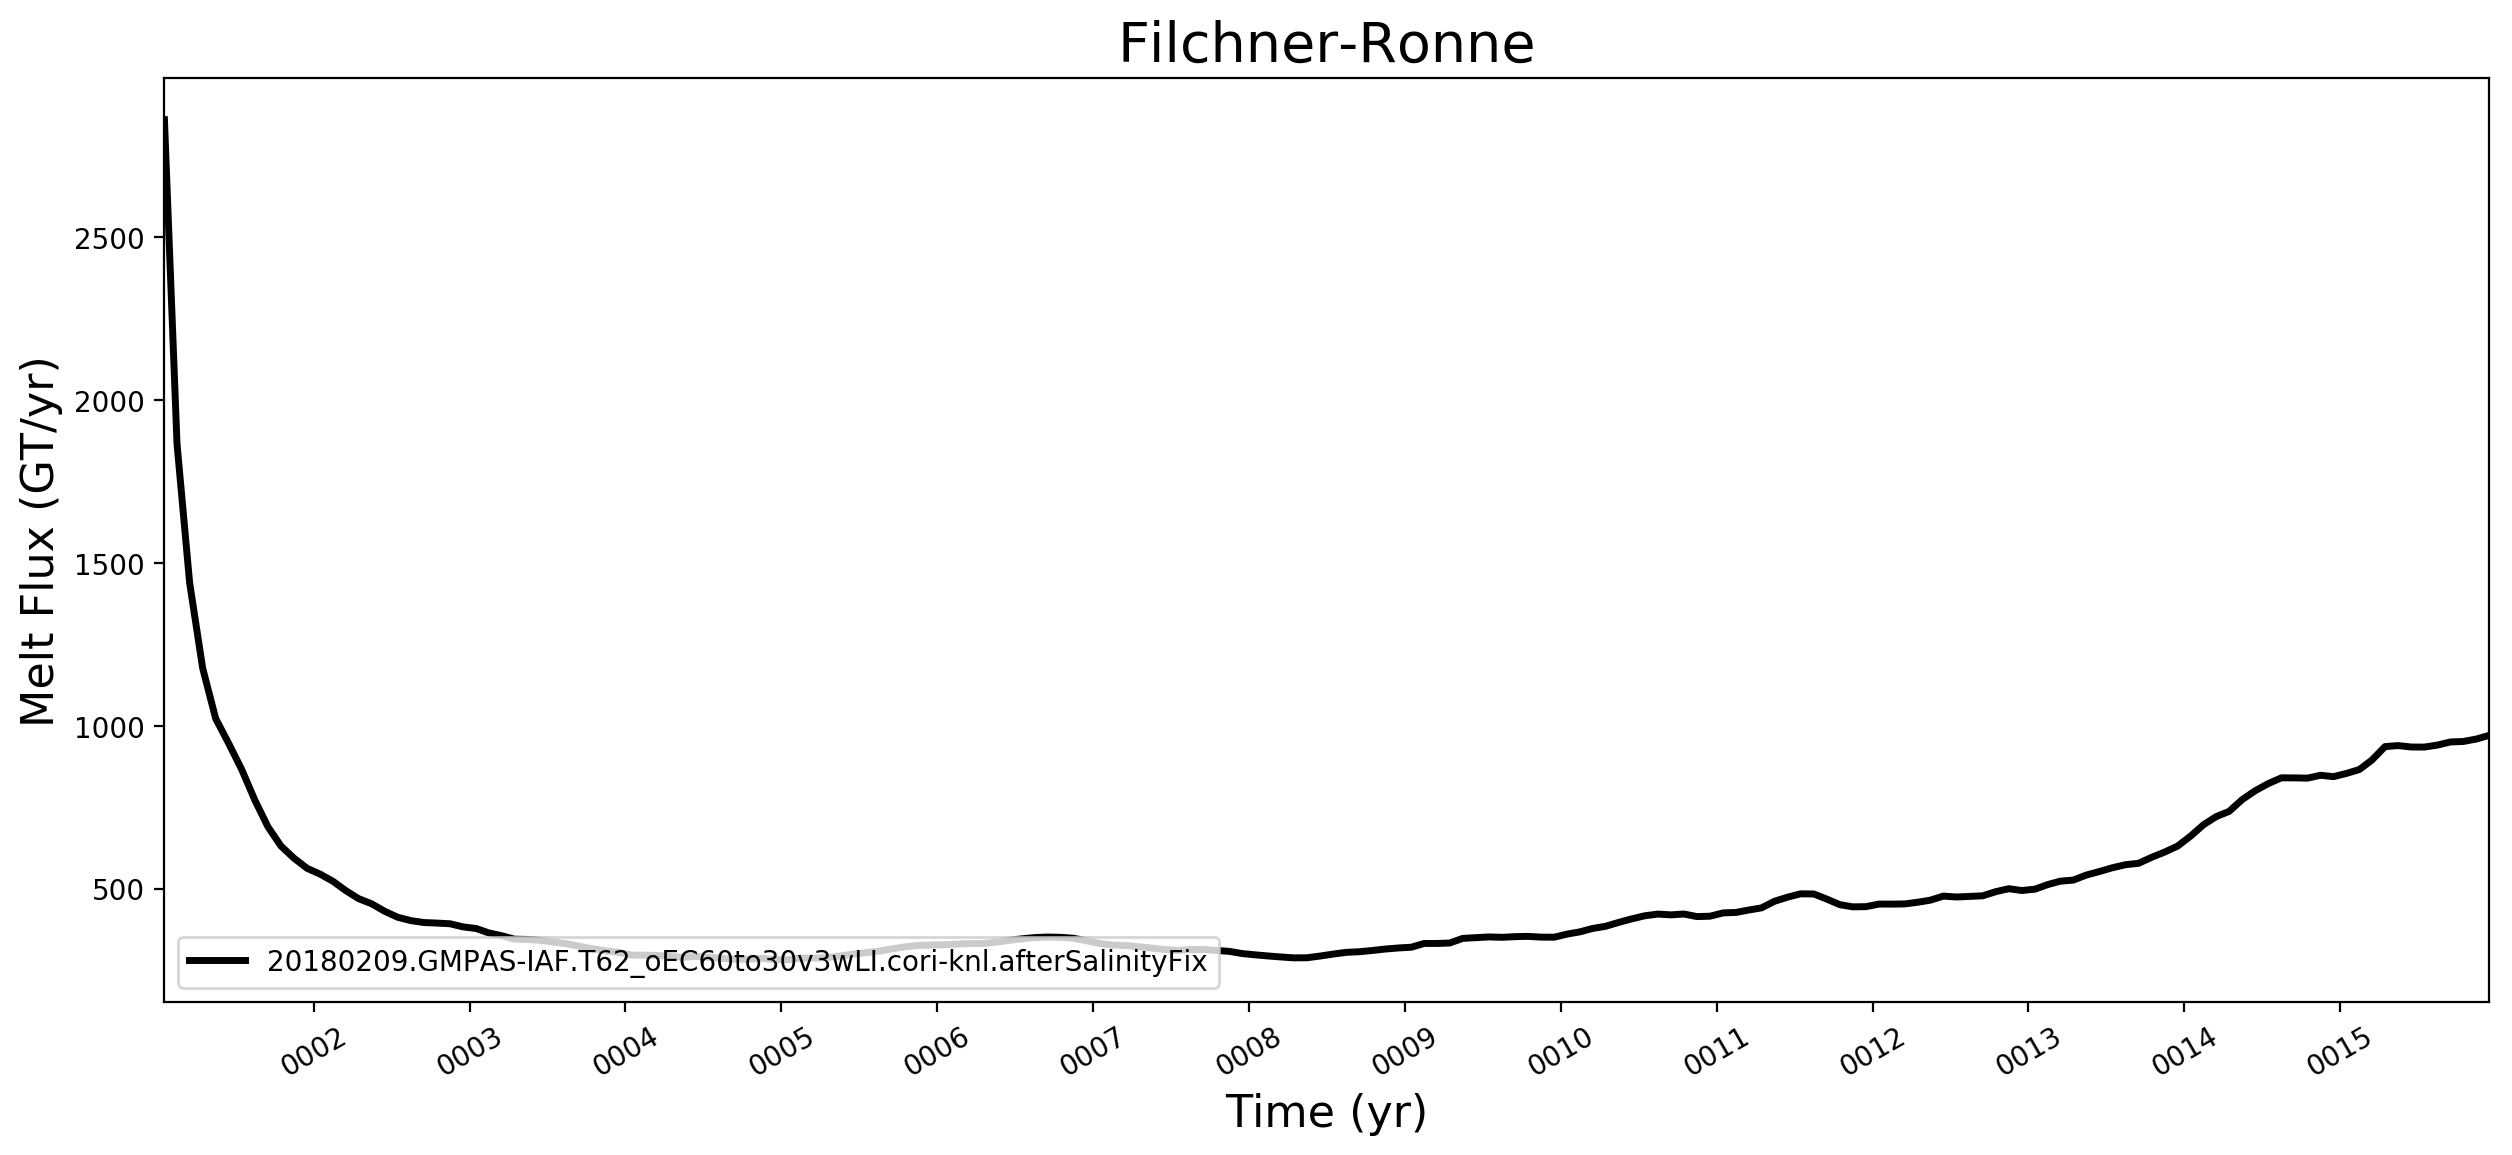
Filchner-Ronne
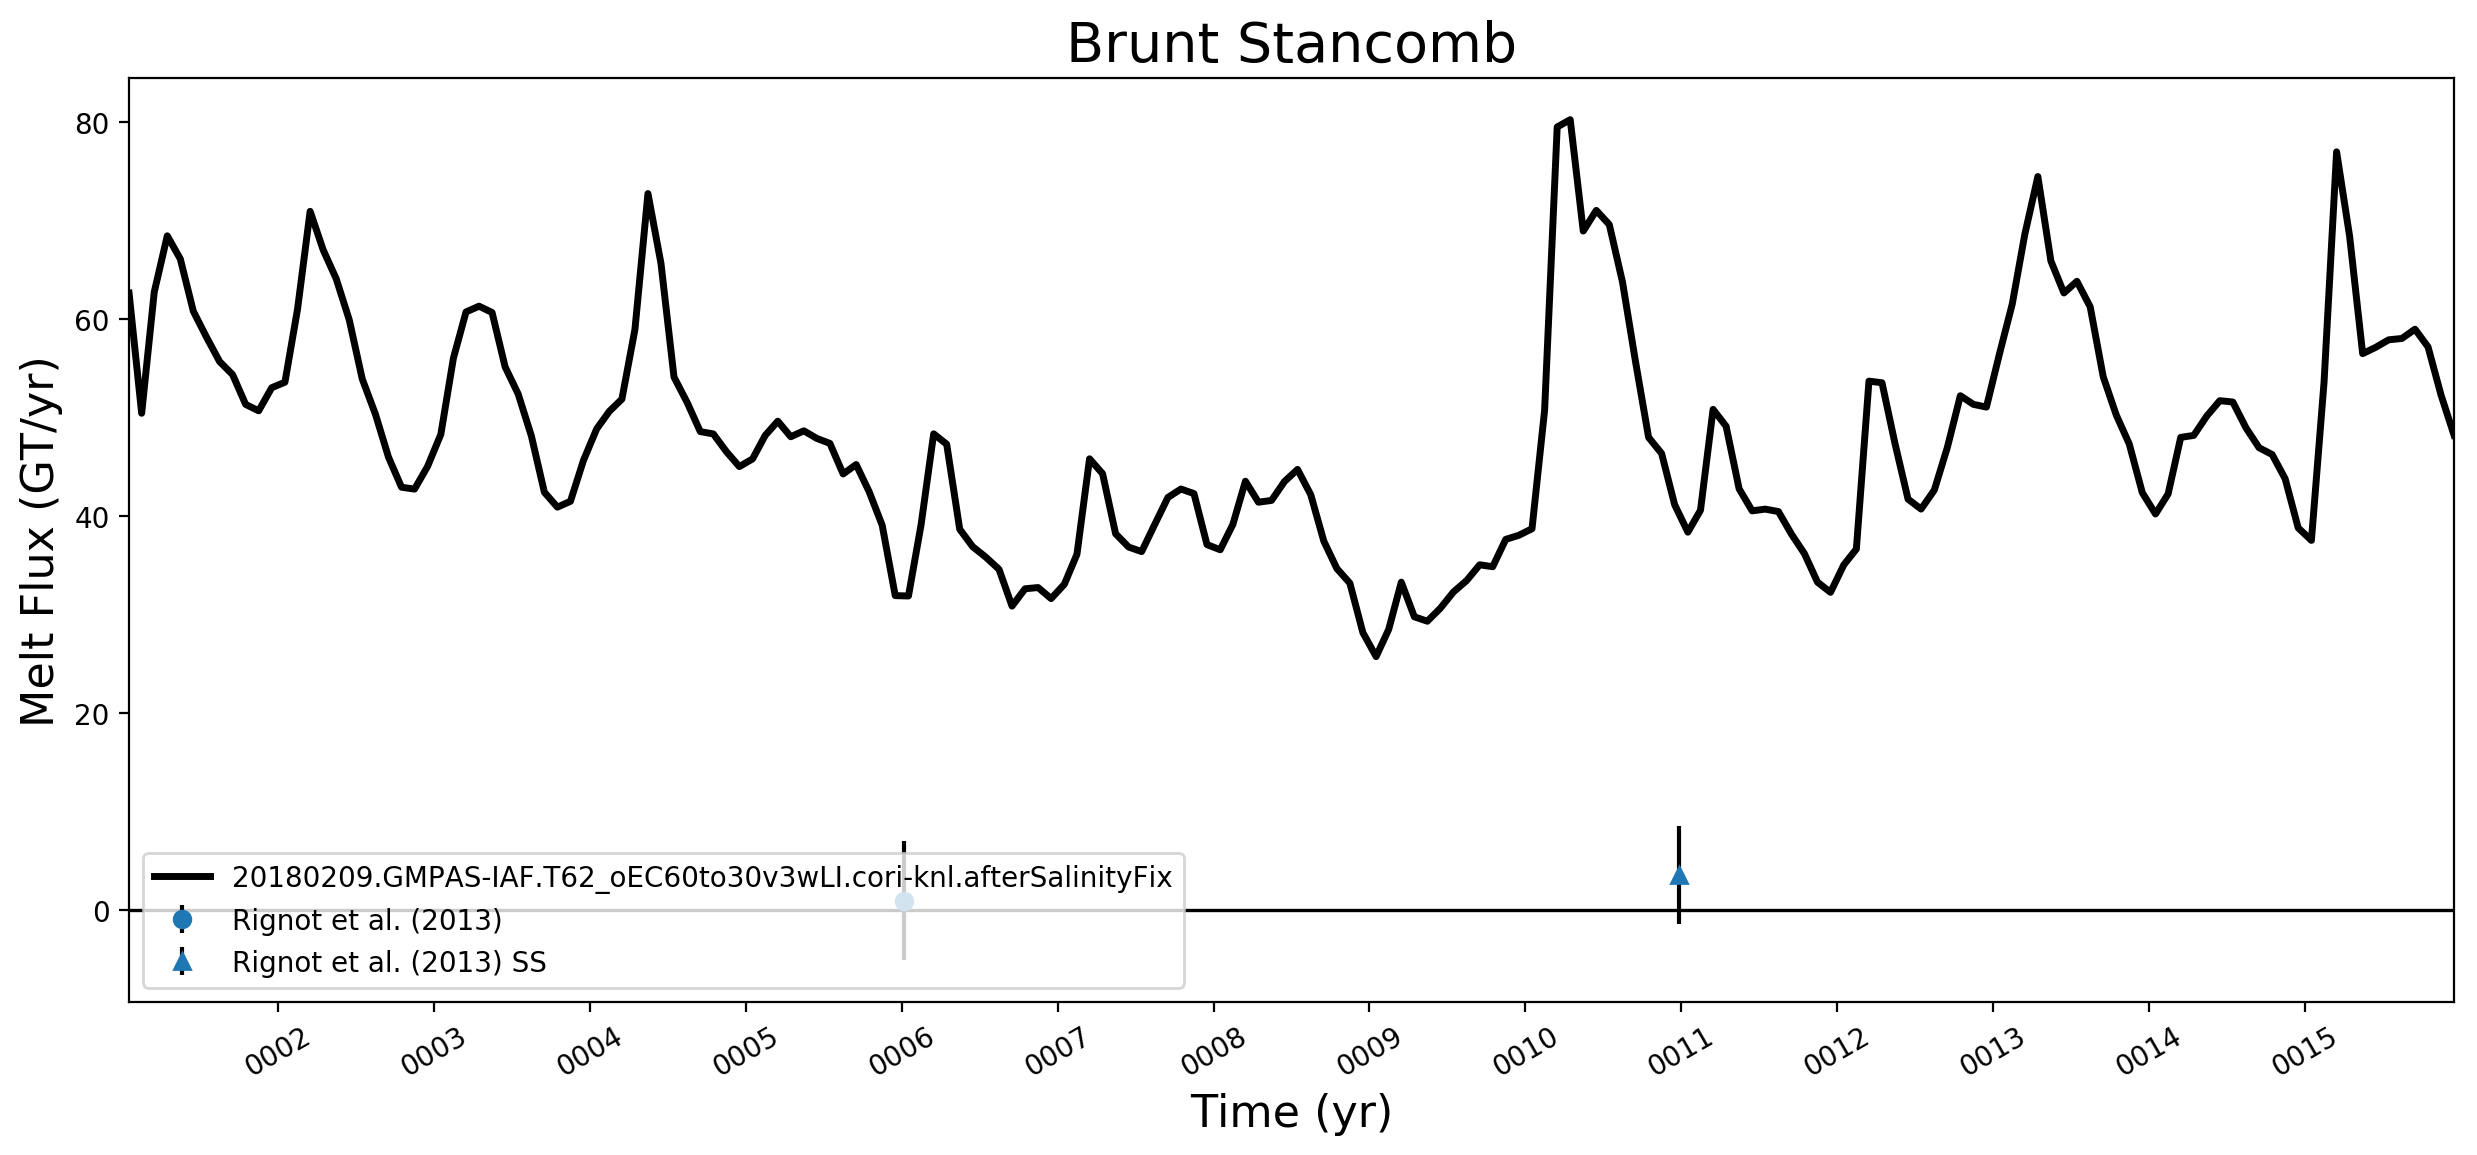
Brunt Stancomb
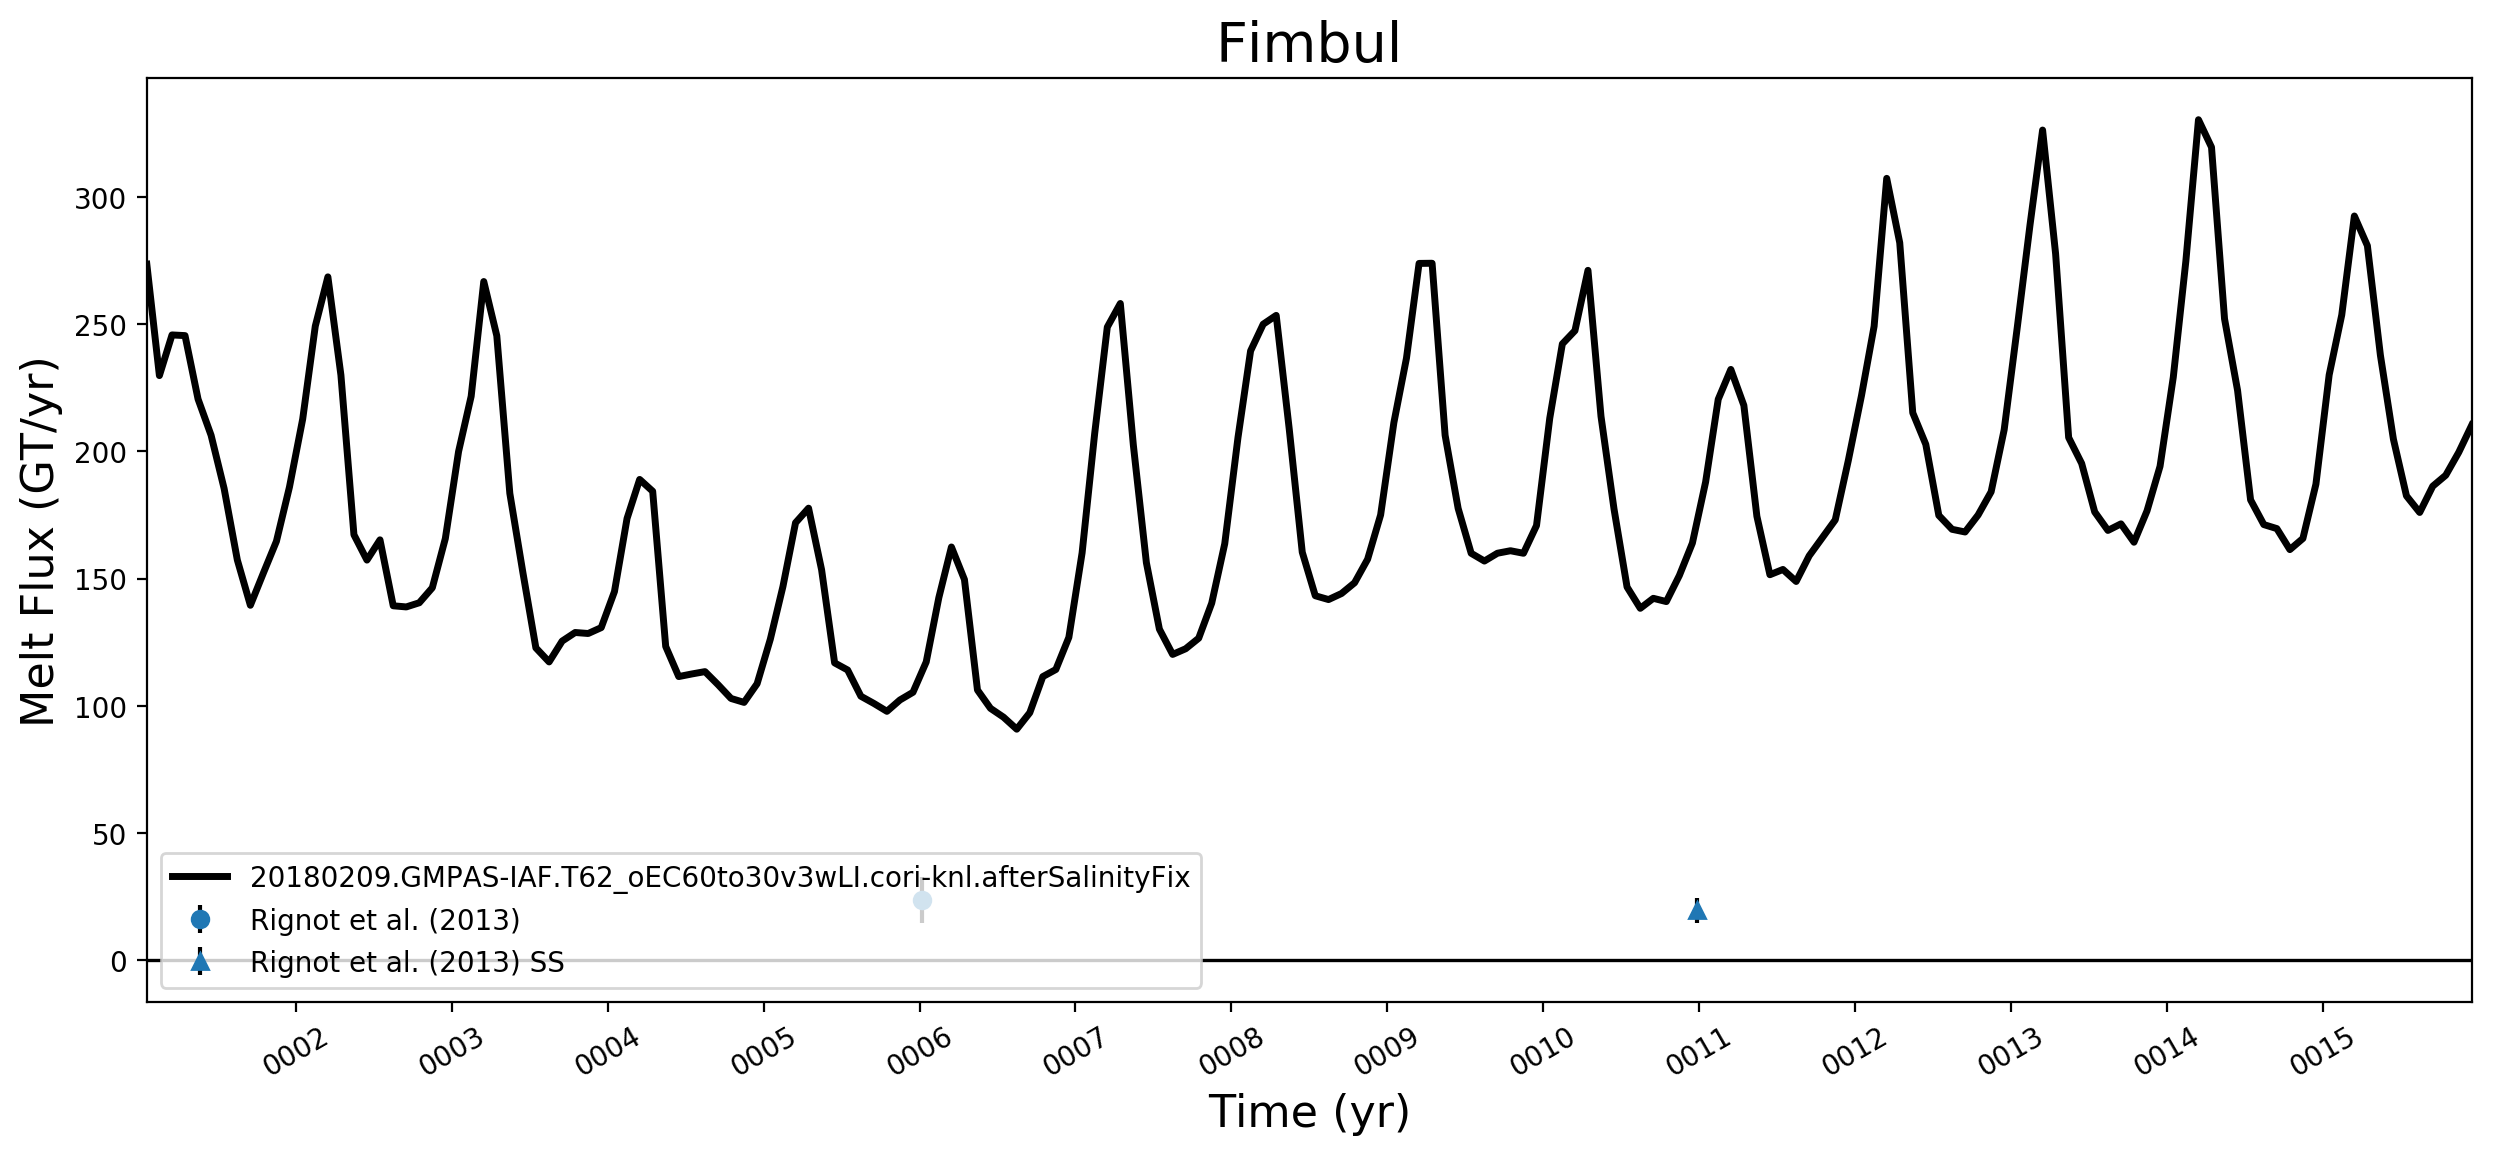
Fimbul
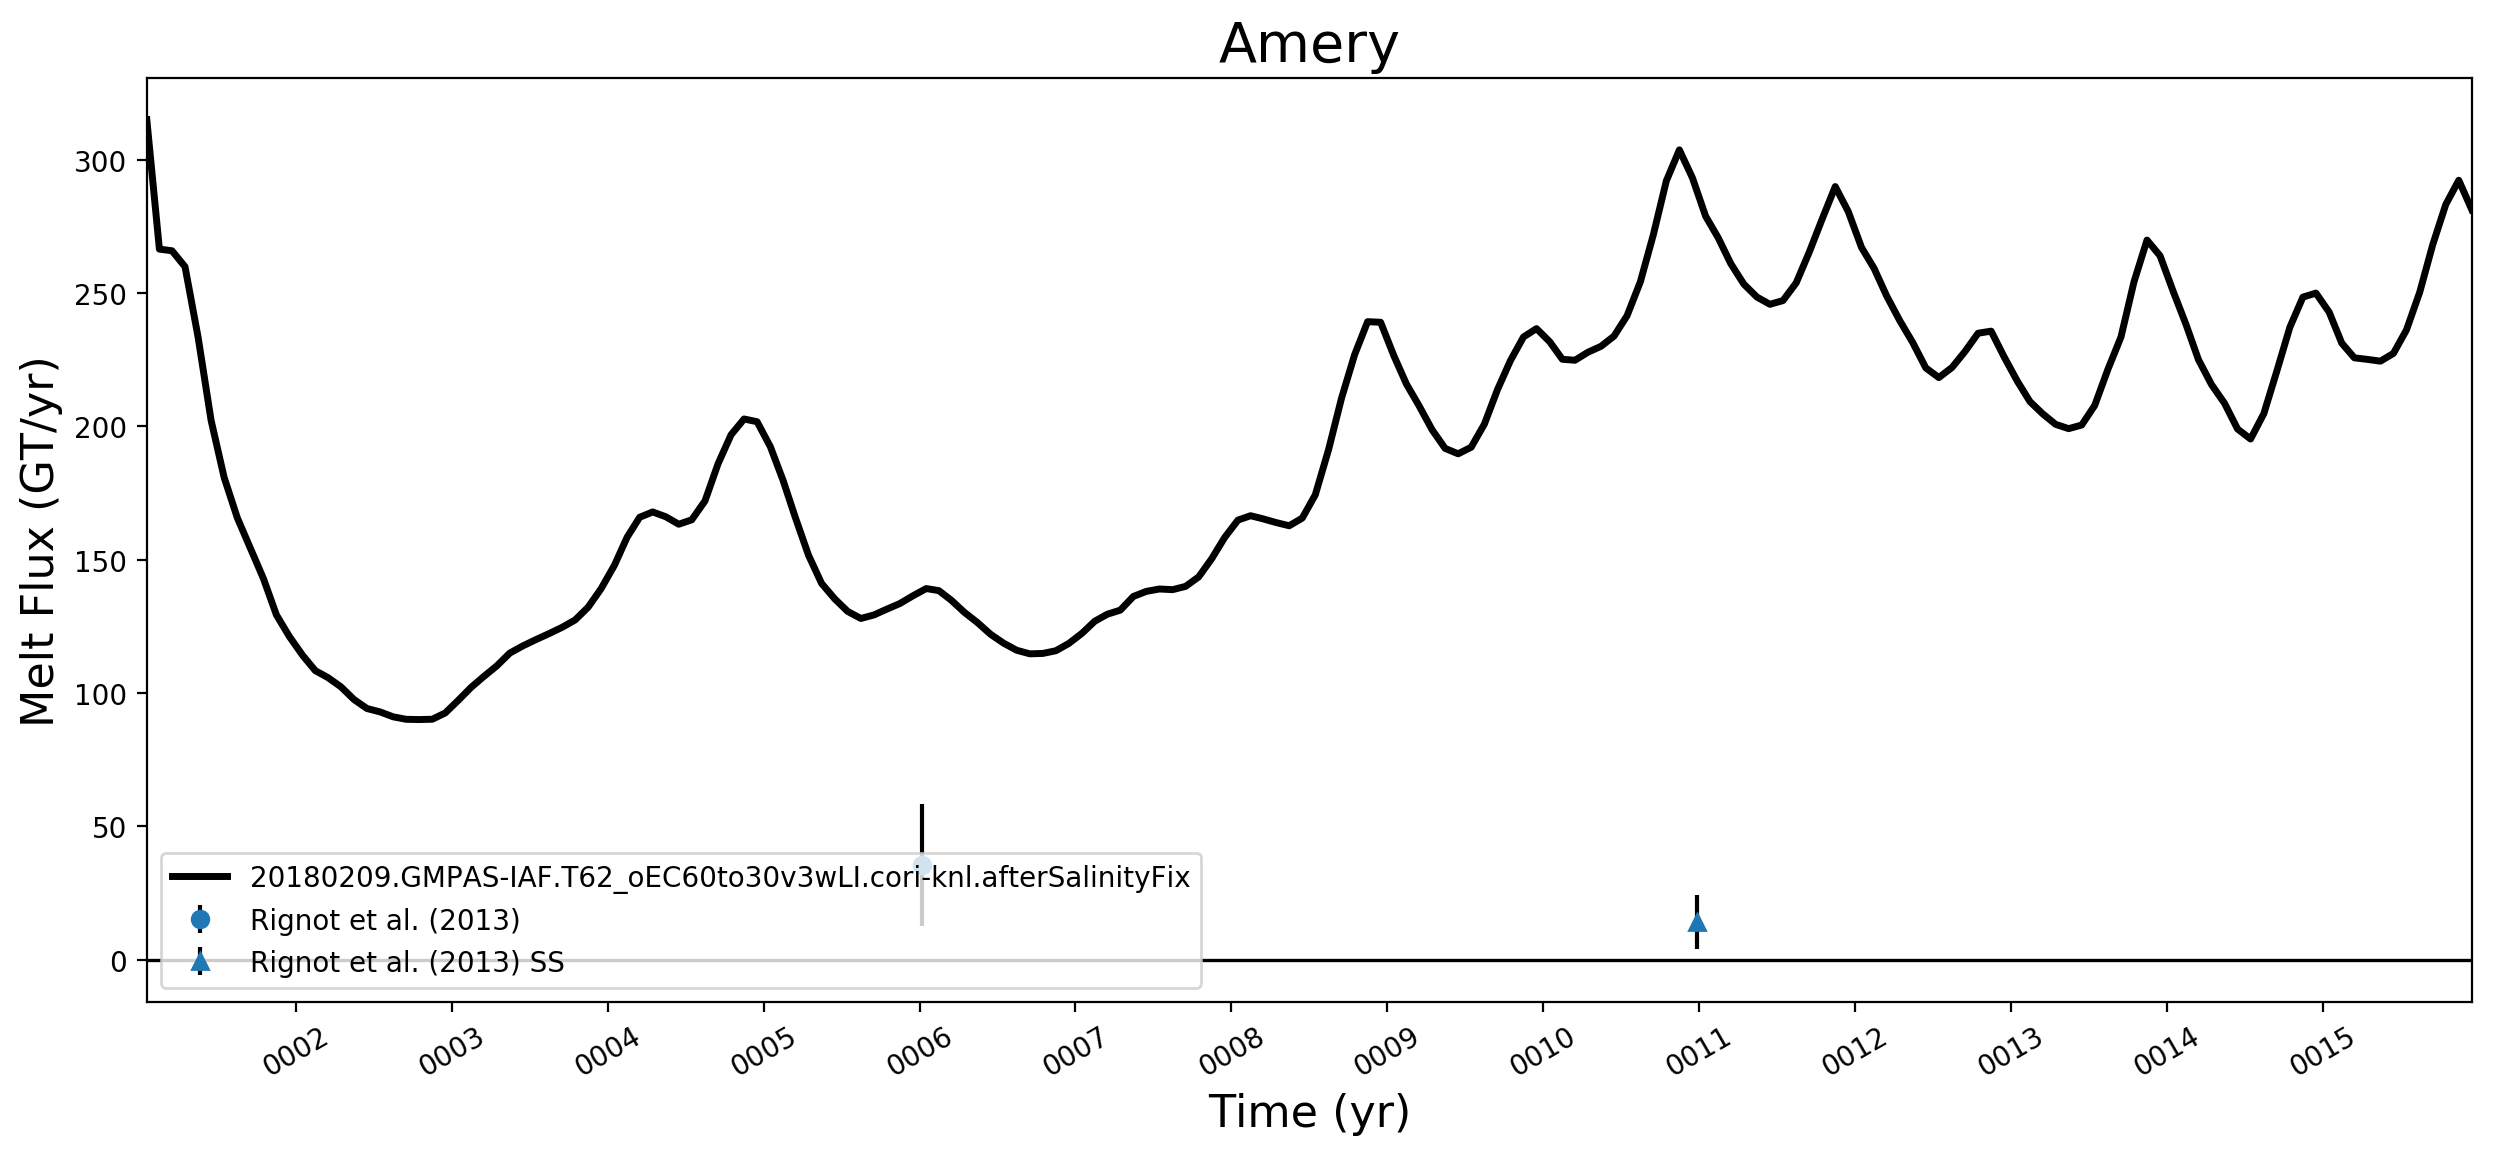
Amery
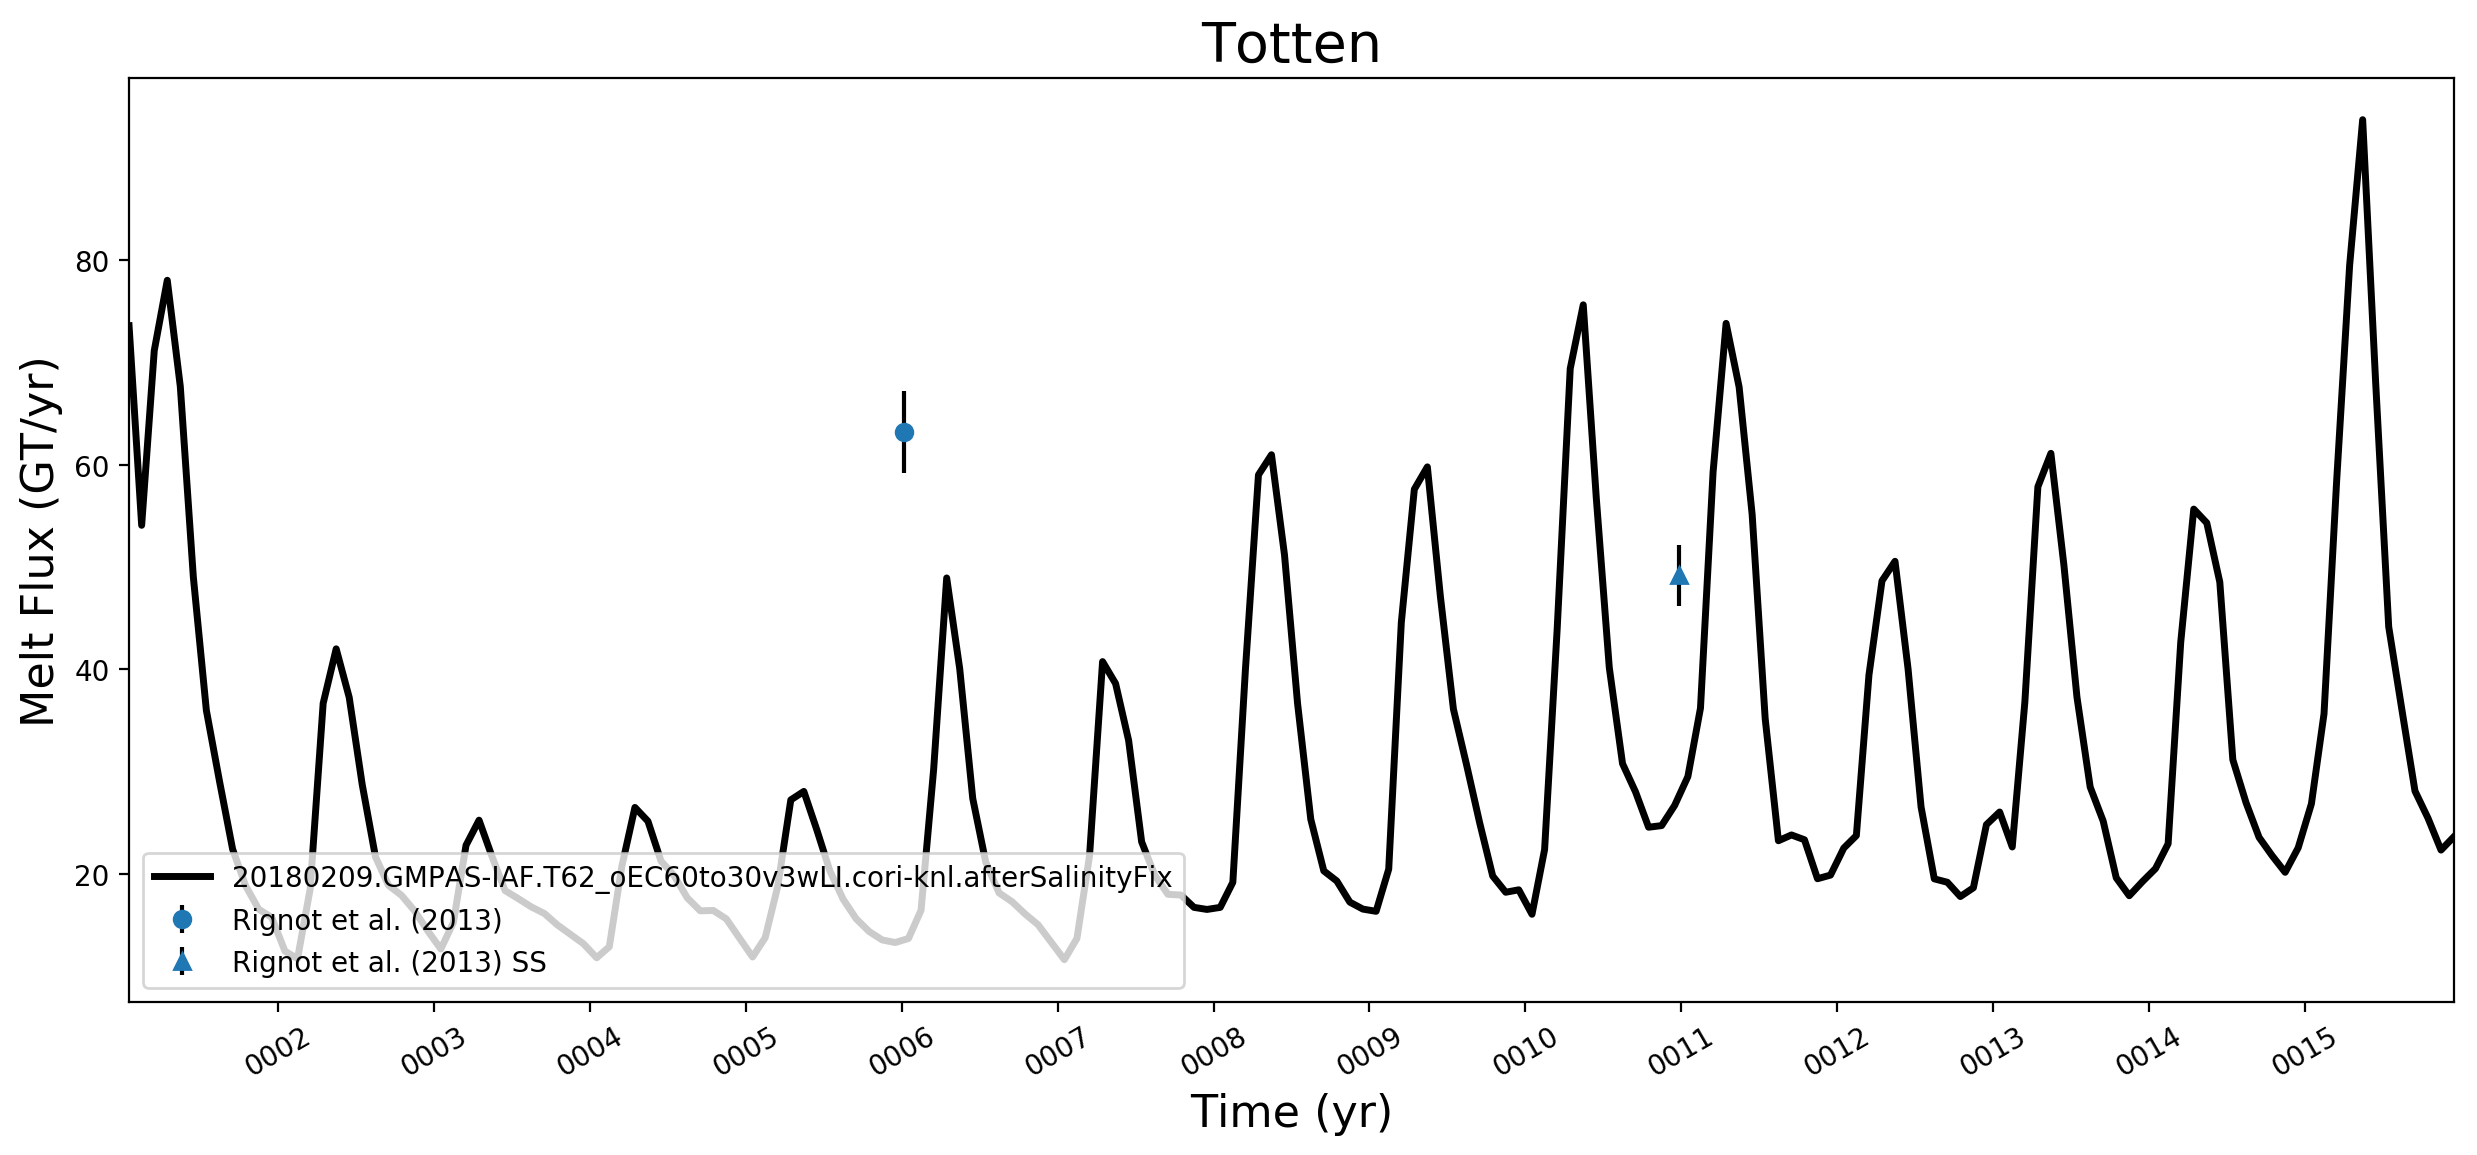
Totten
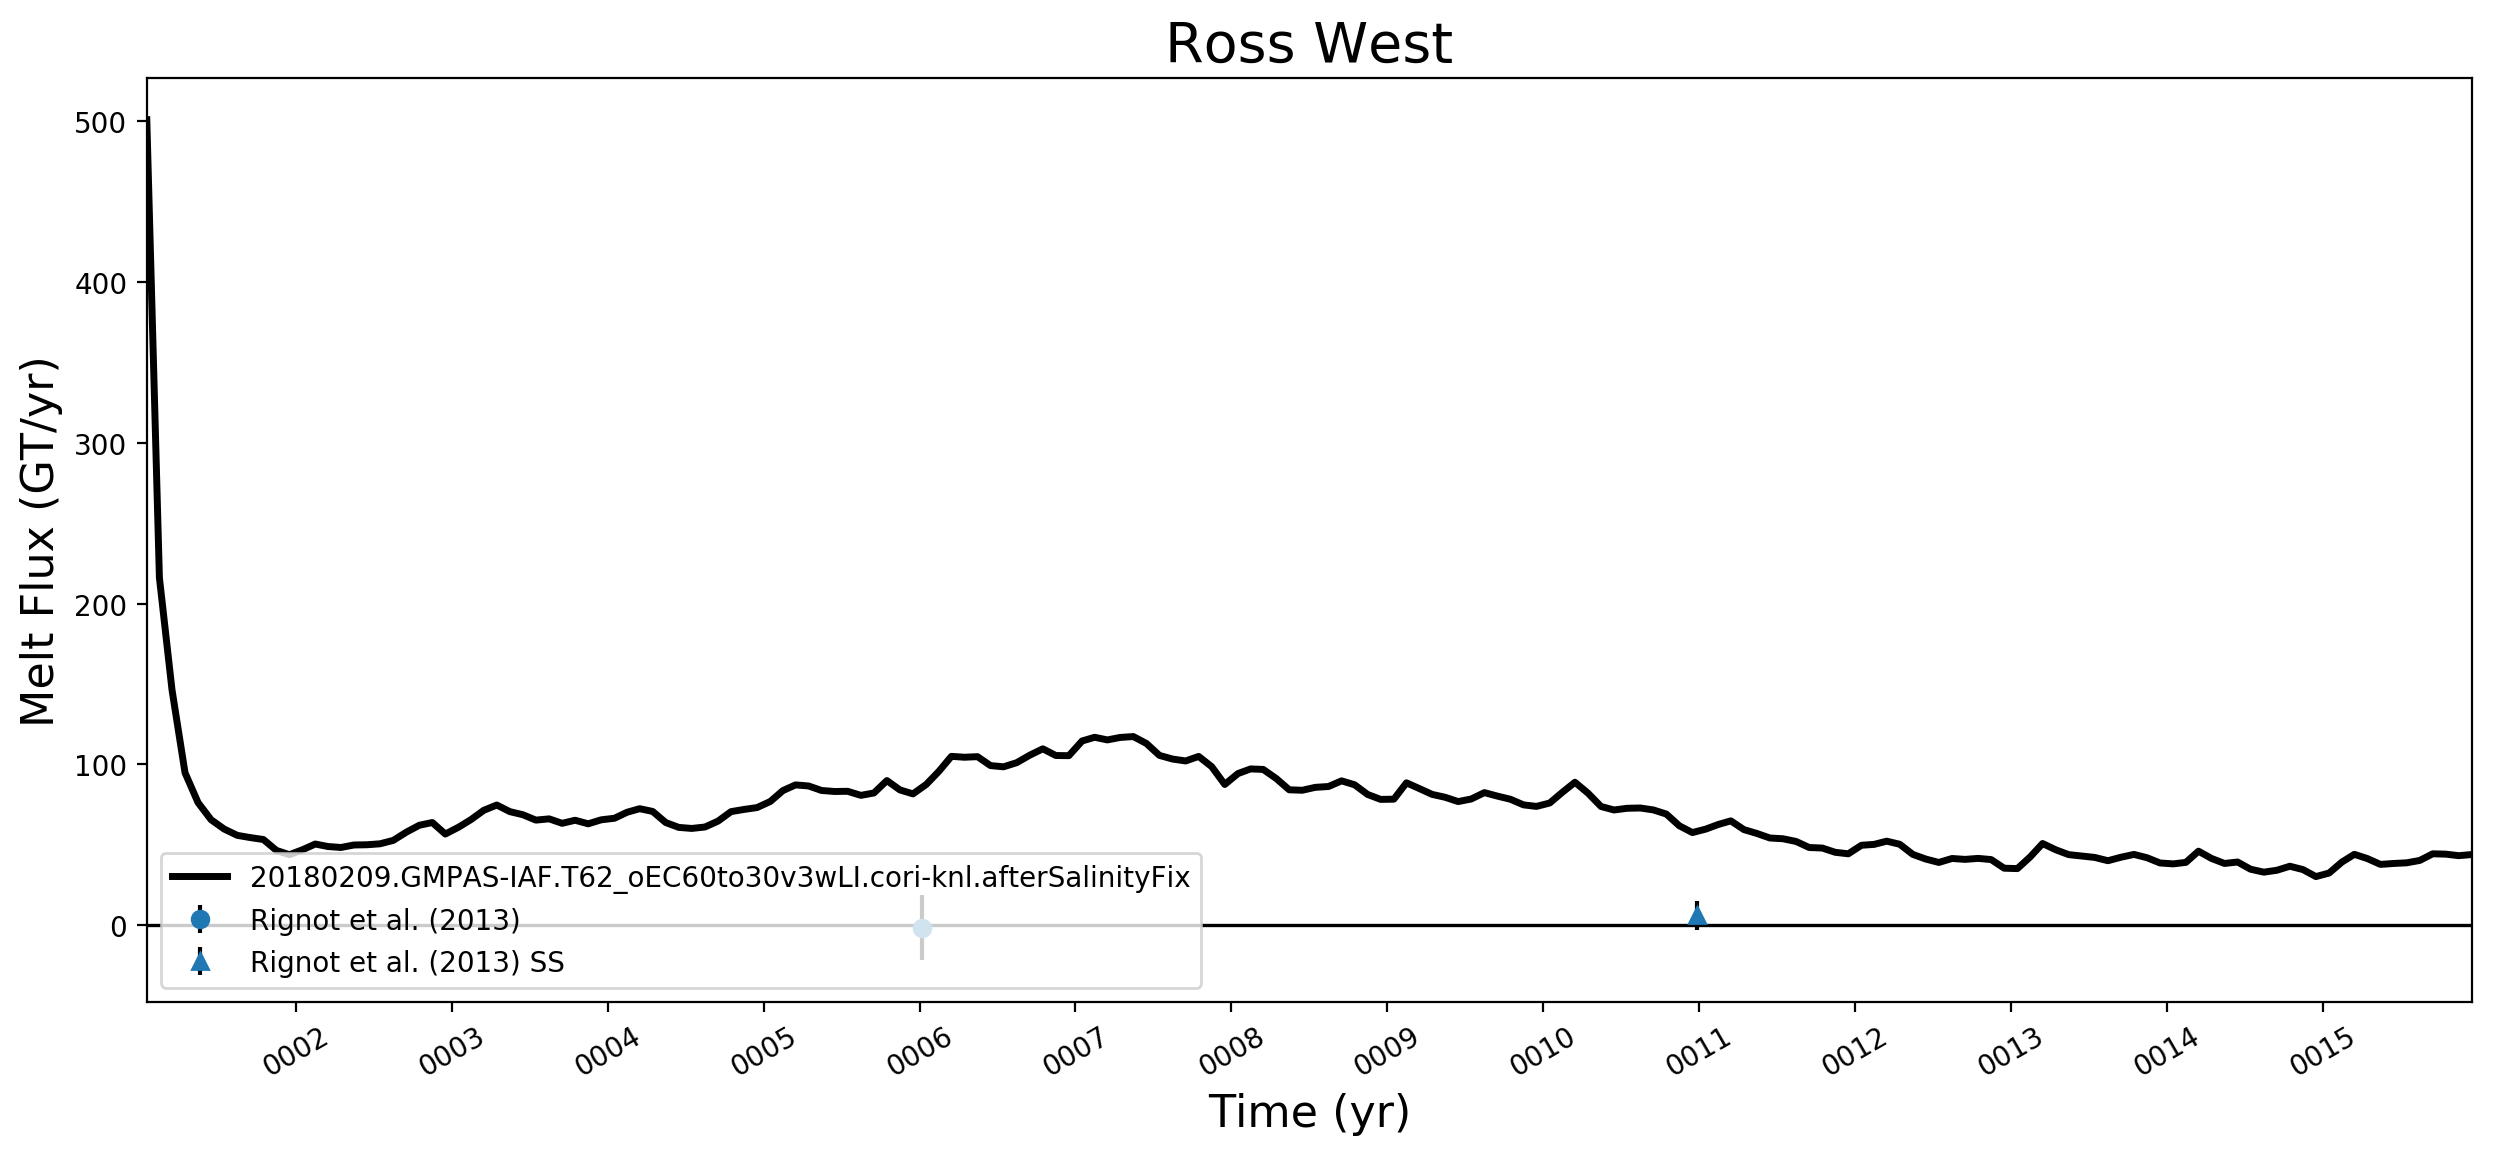
Ross West
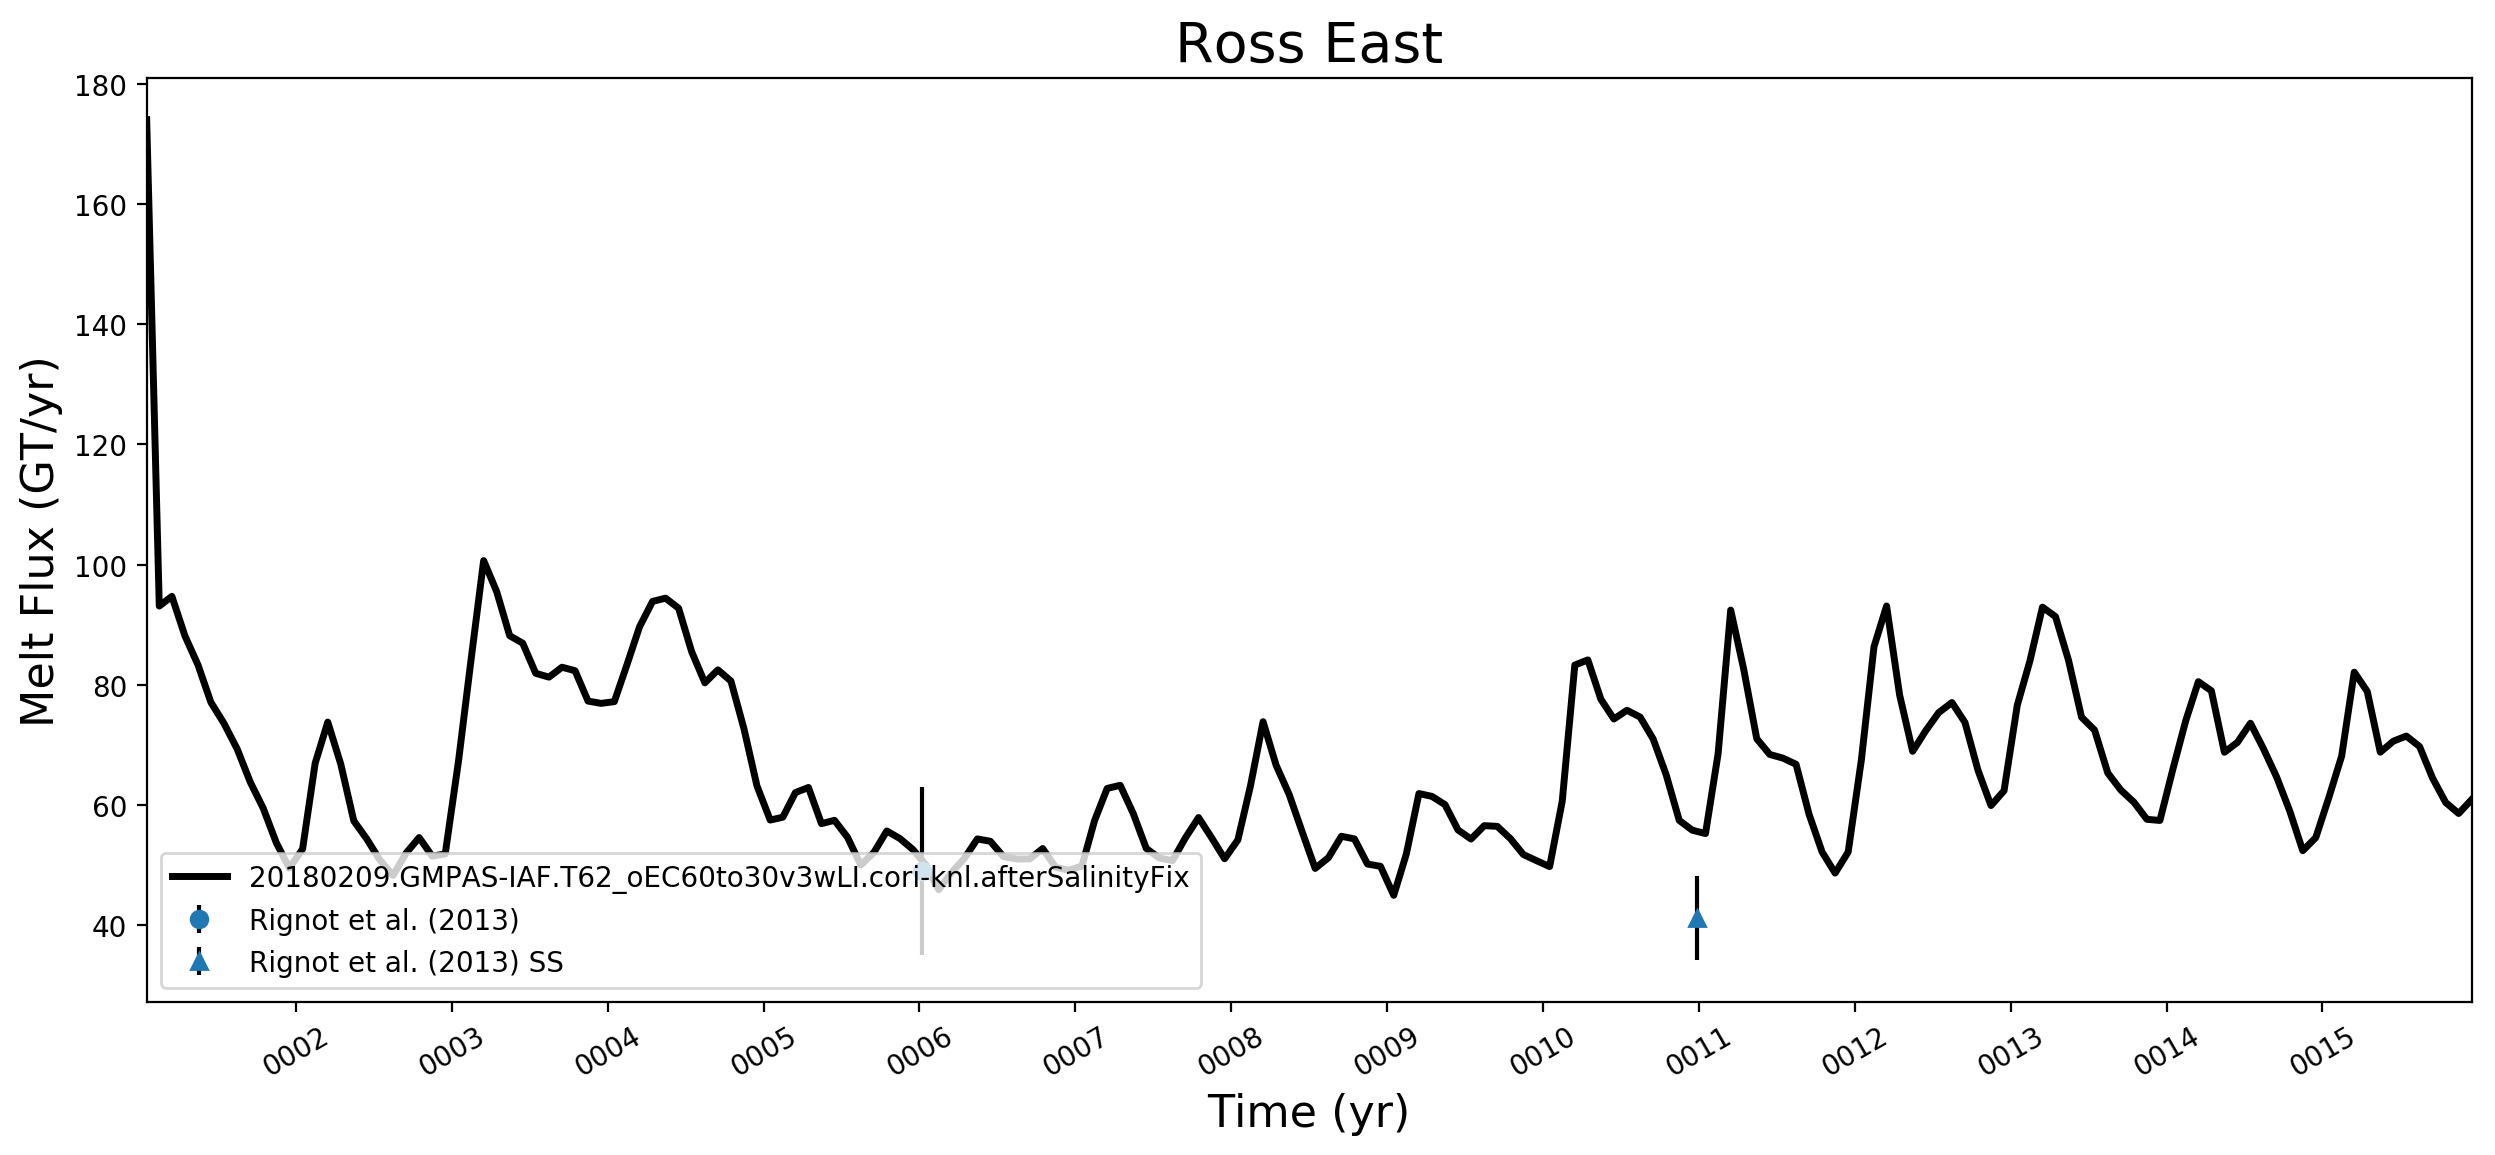
Ross East
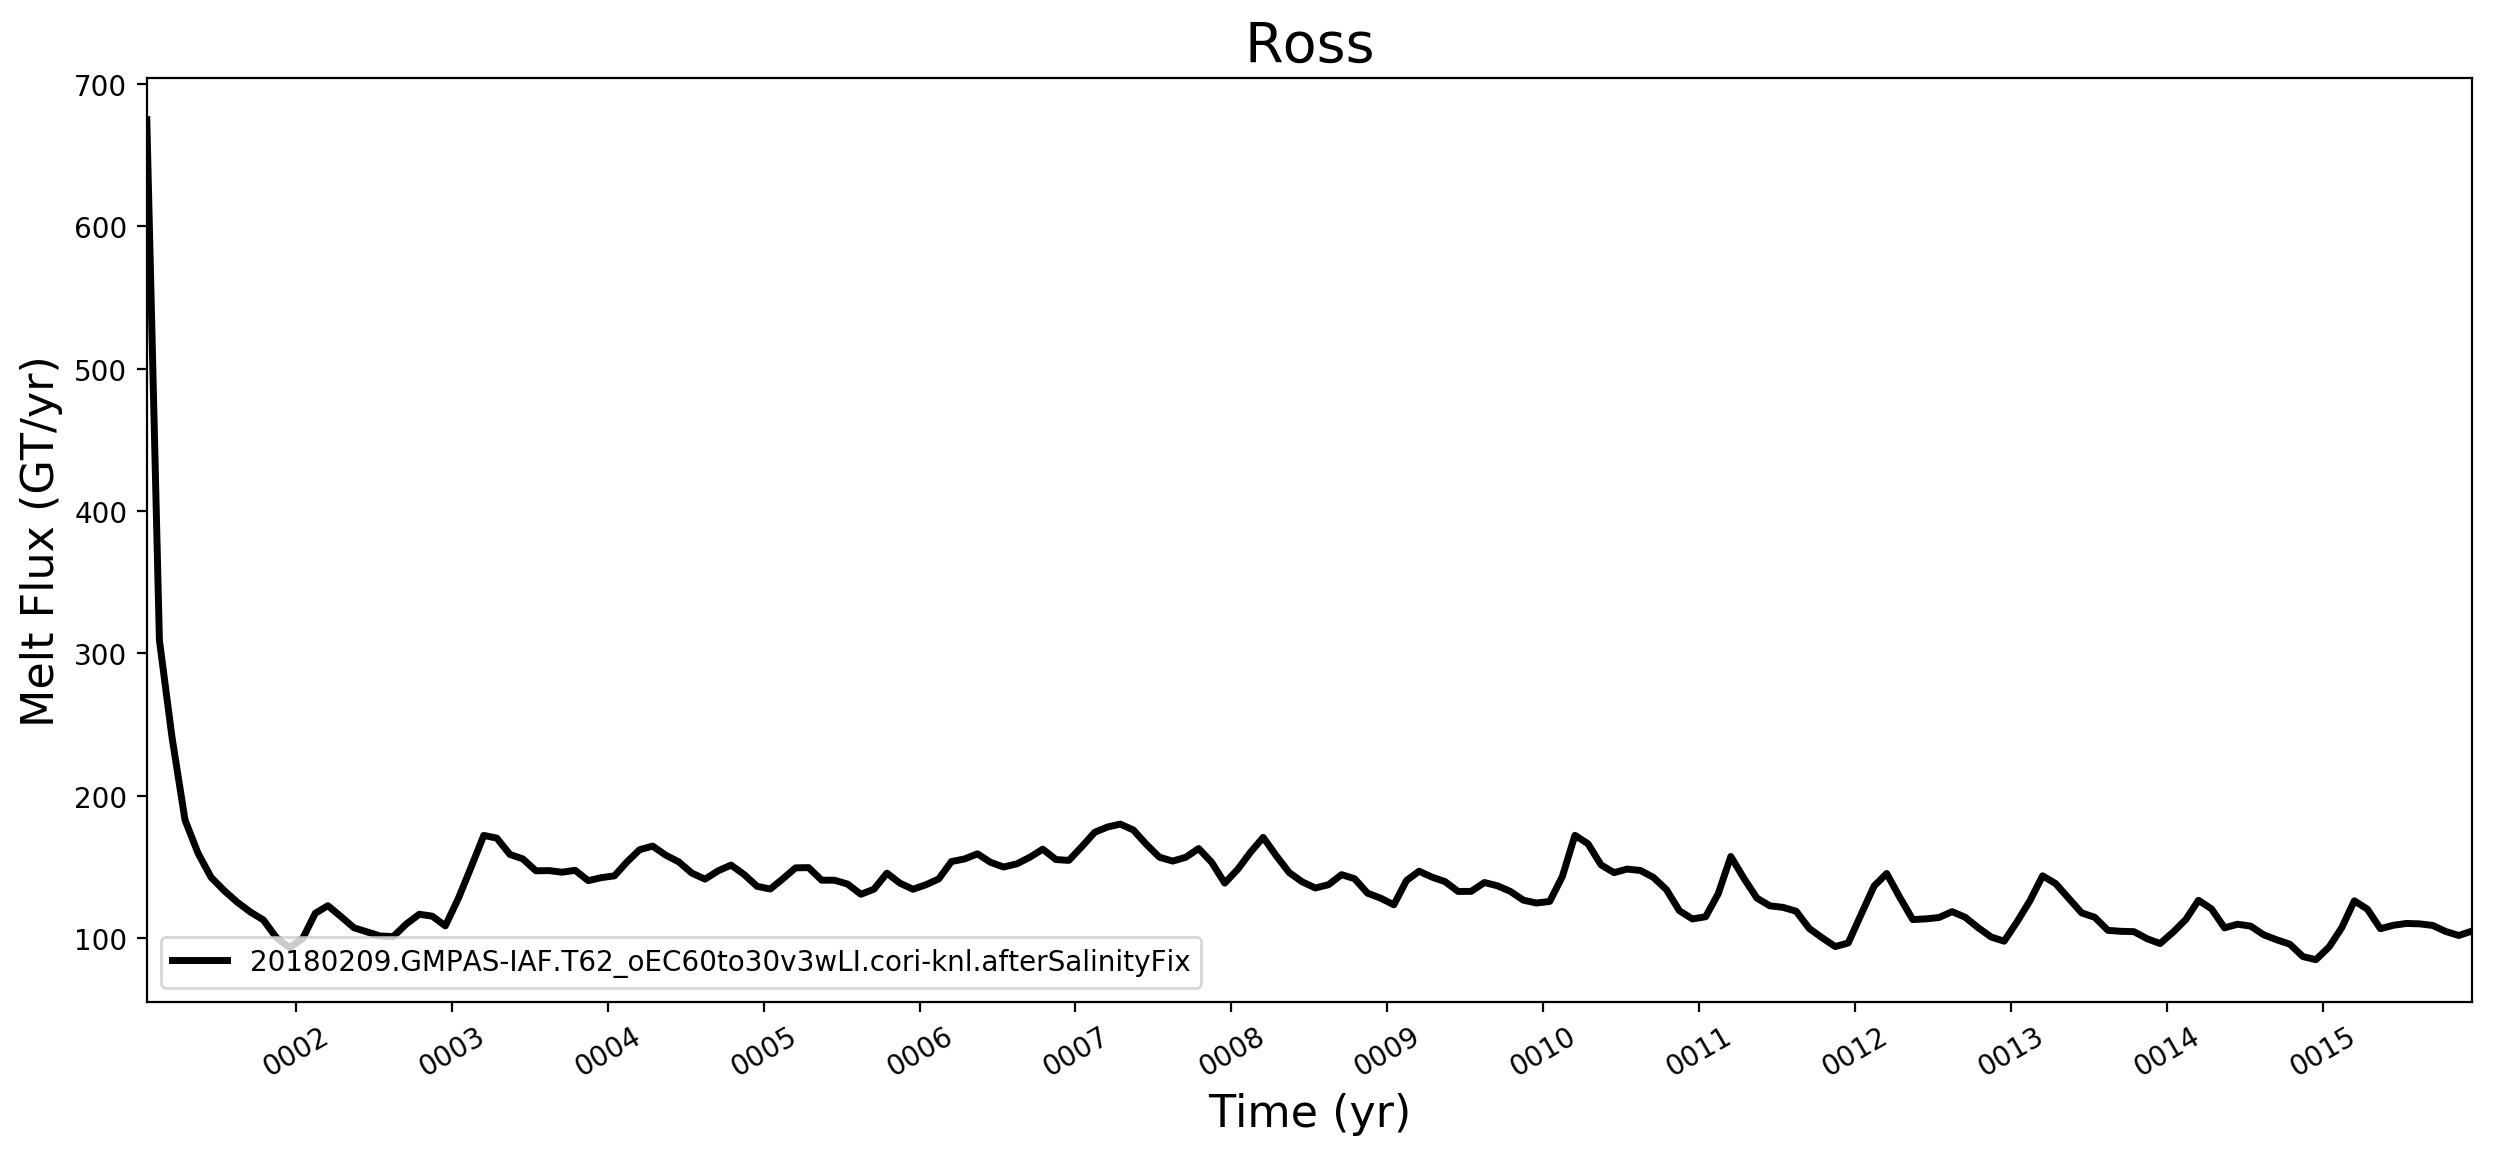
Ross
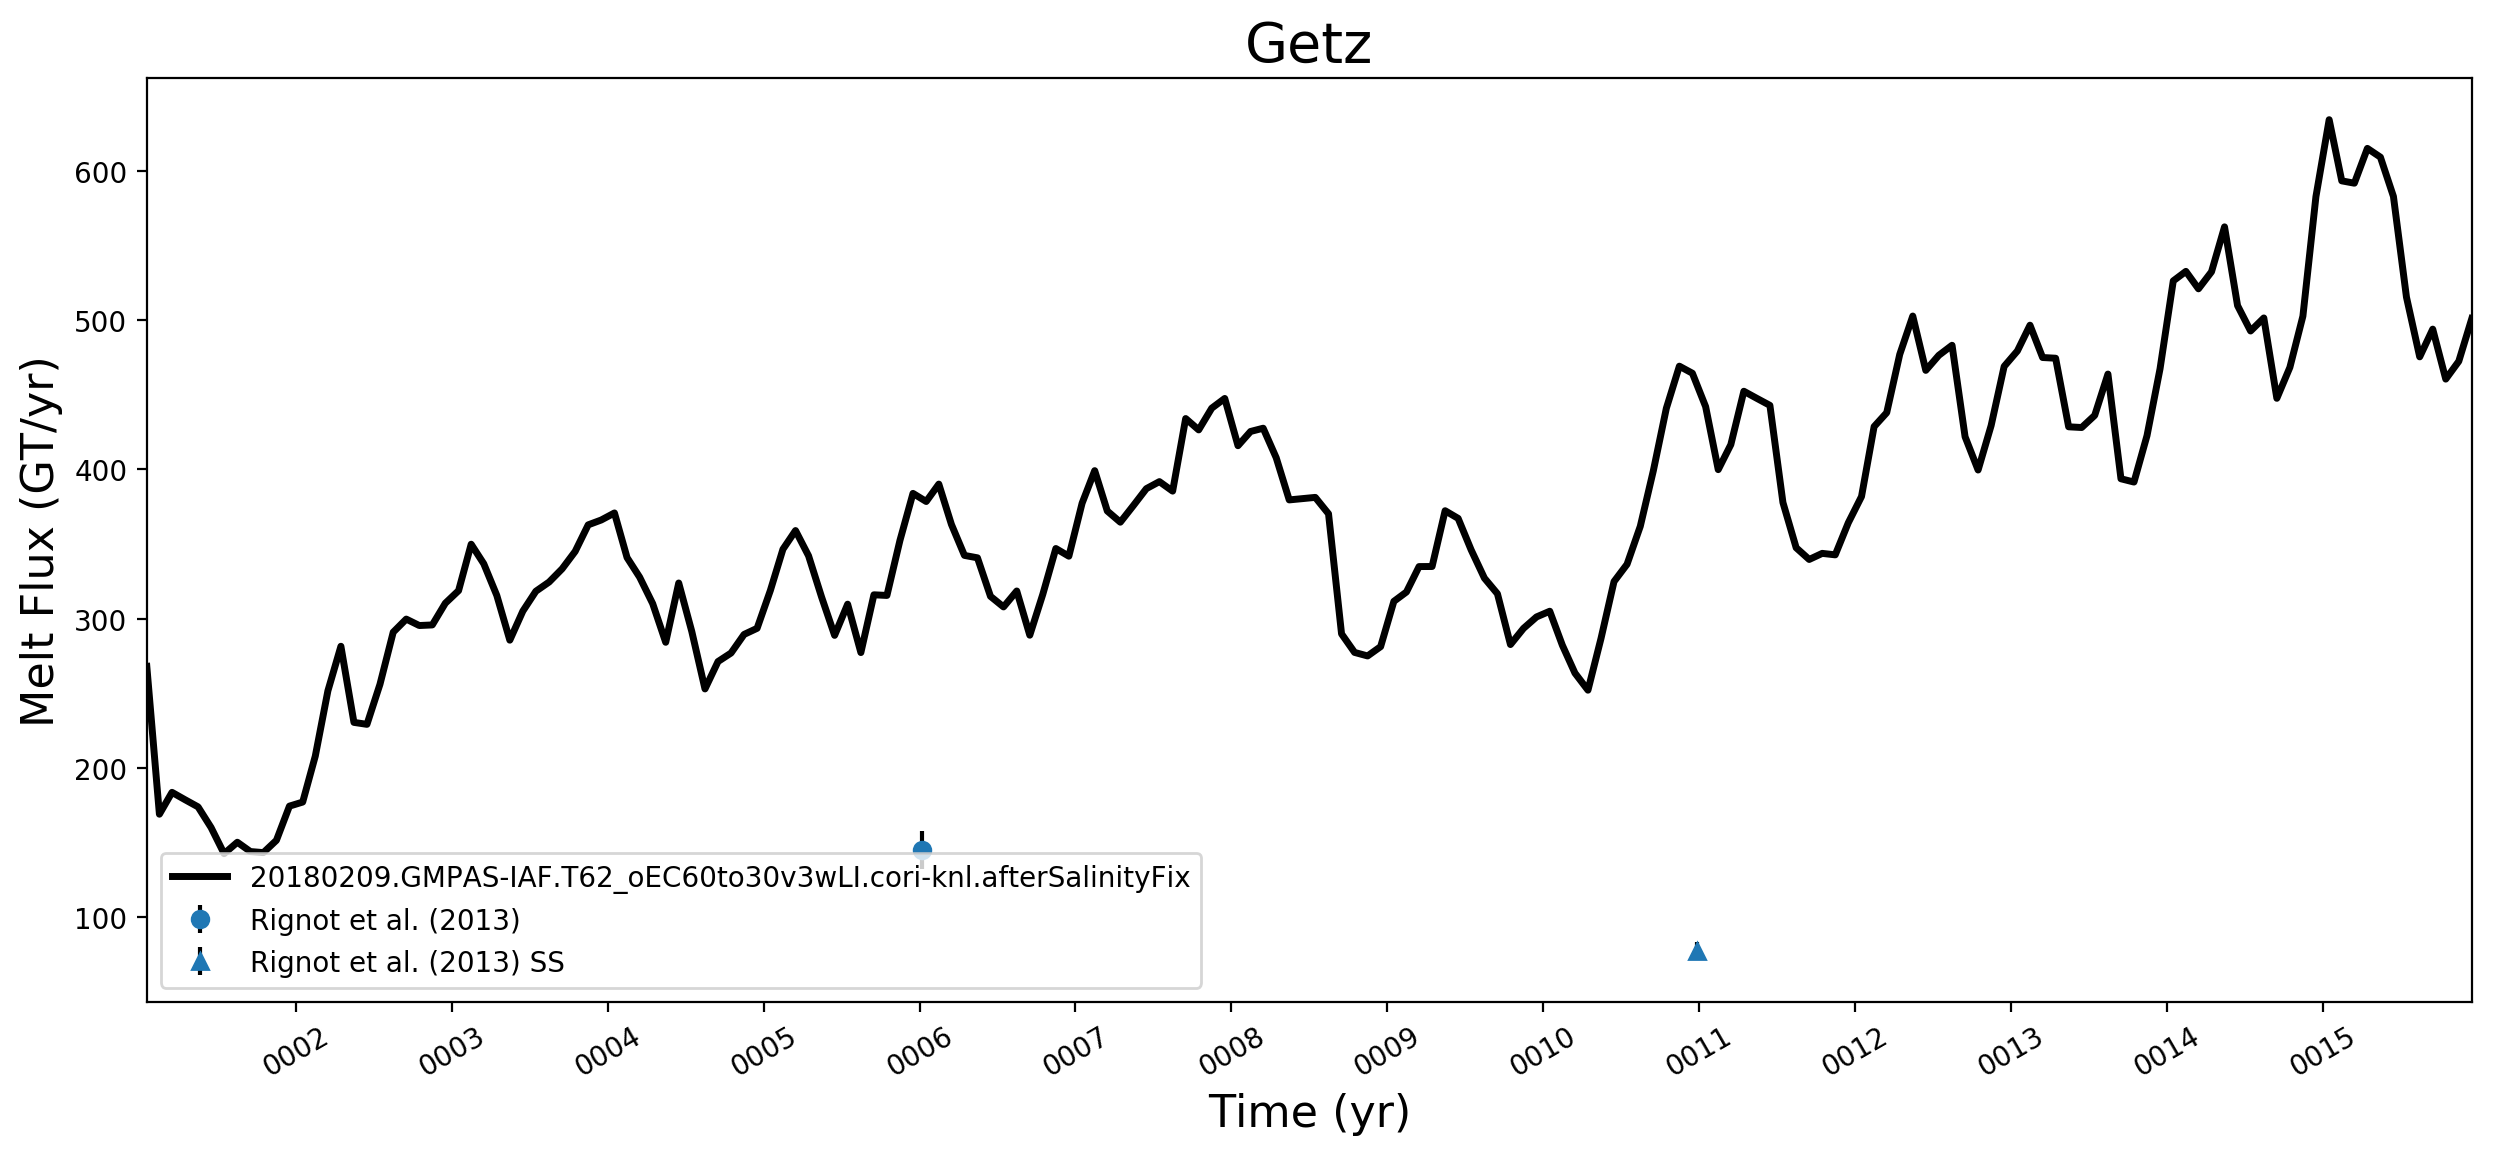
Getz
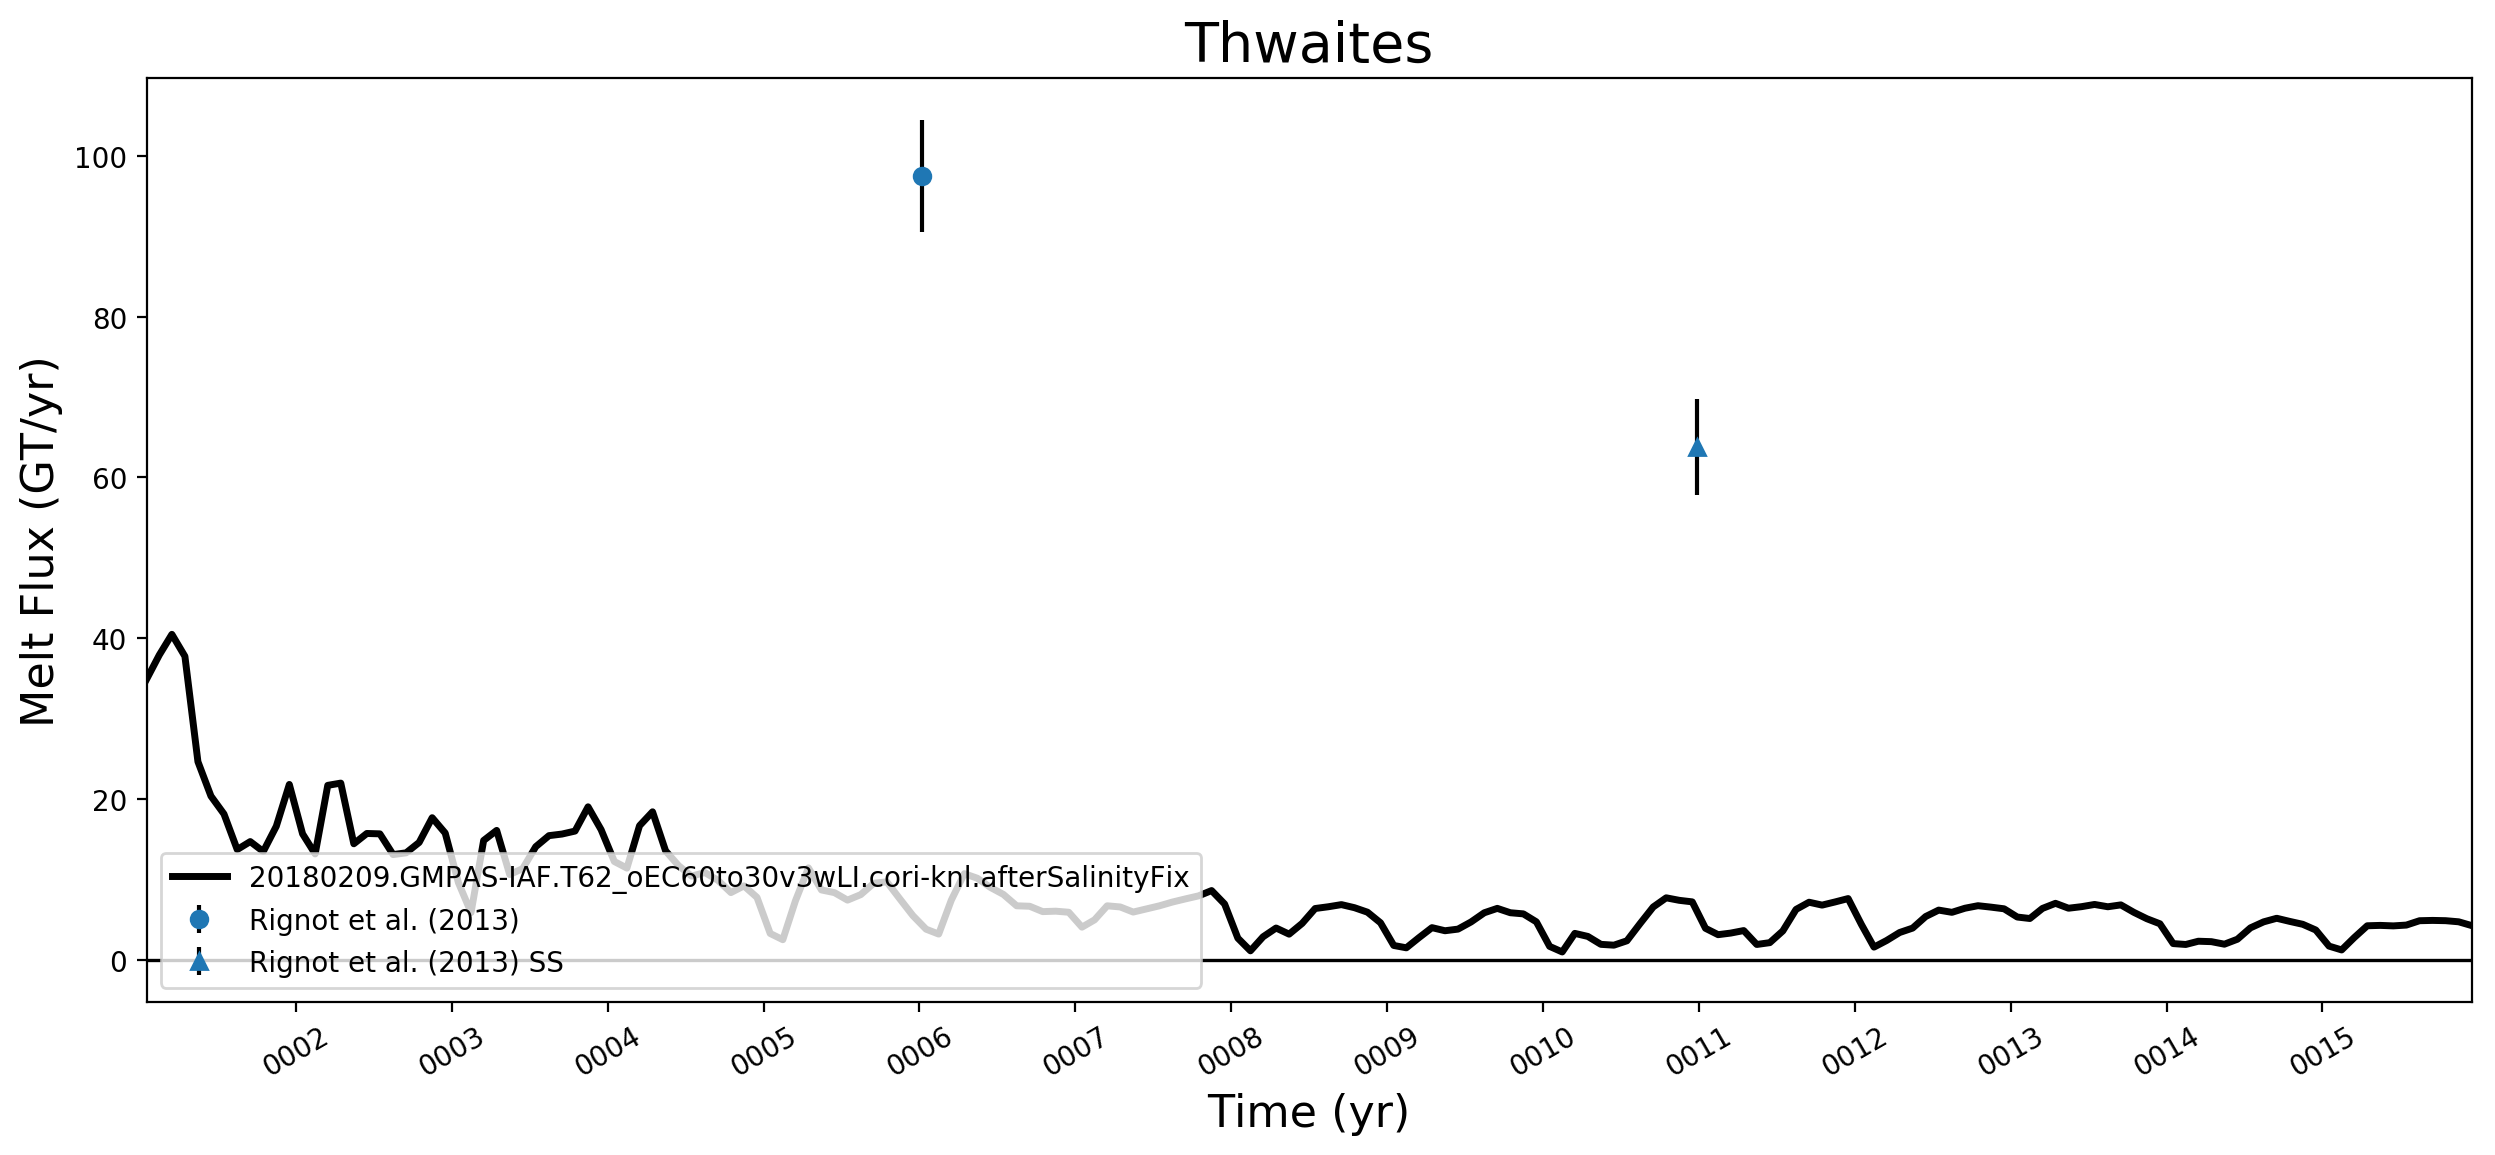
Thwaites
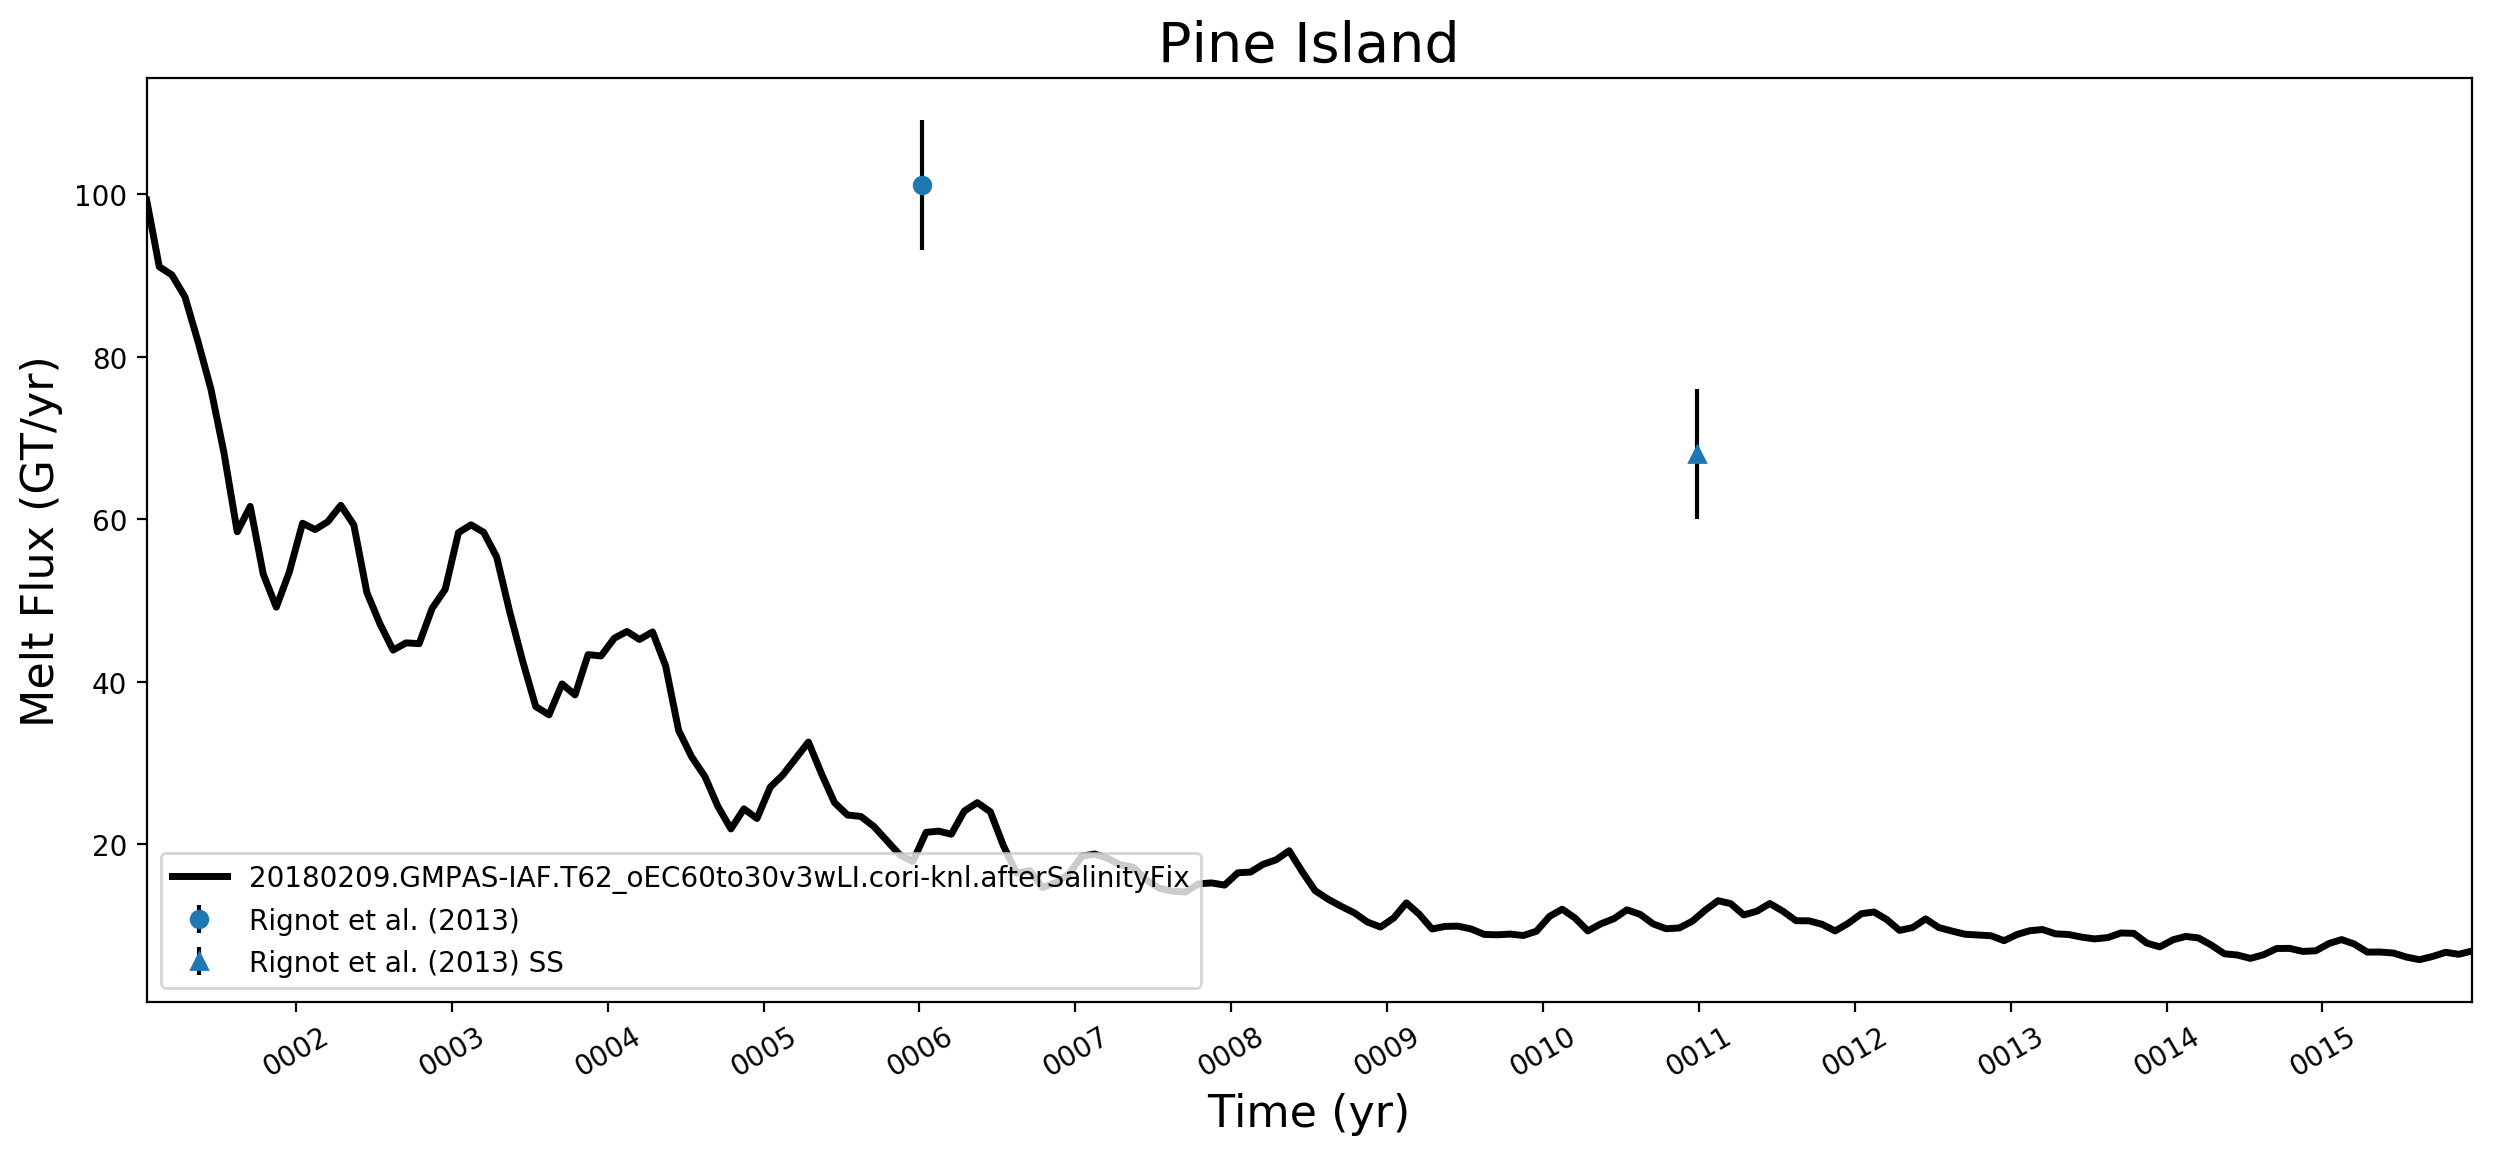
Pine Island
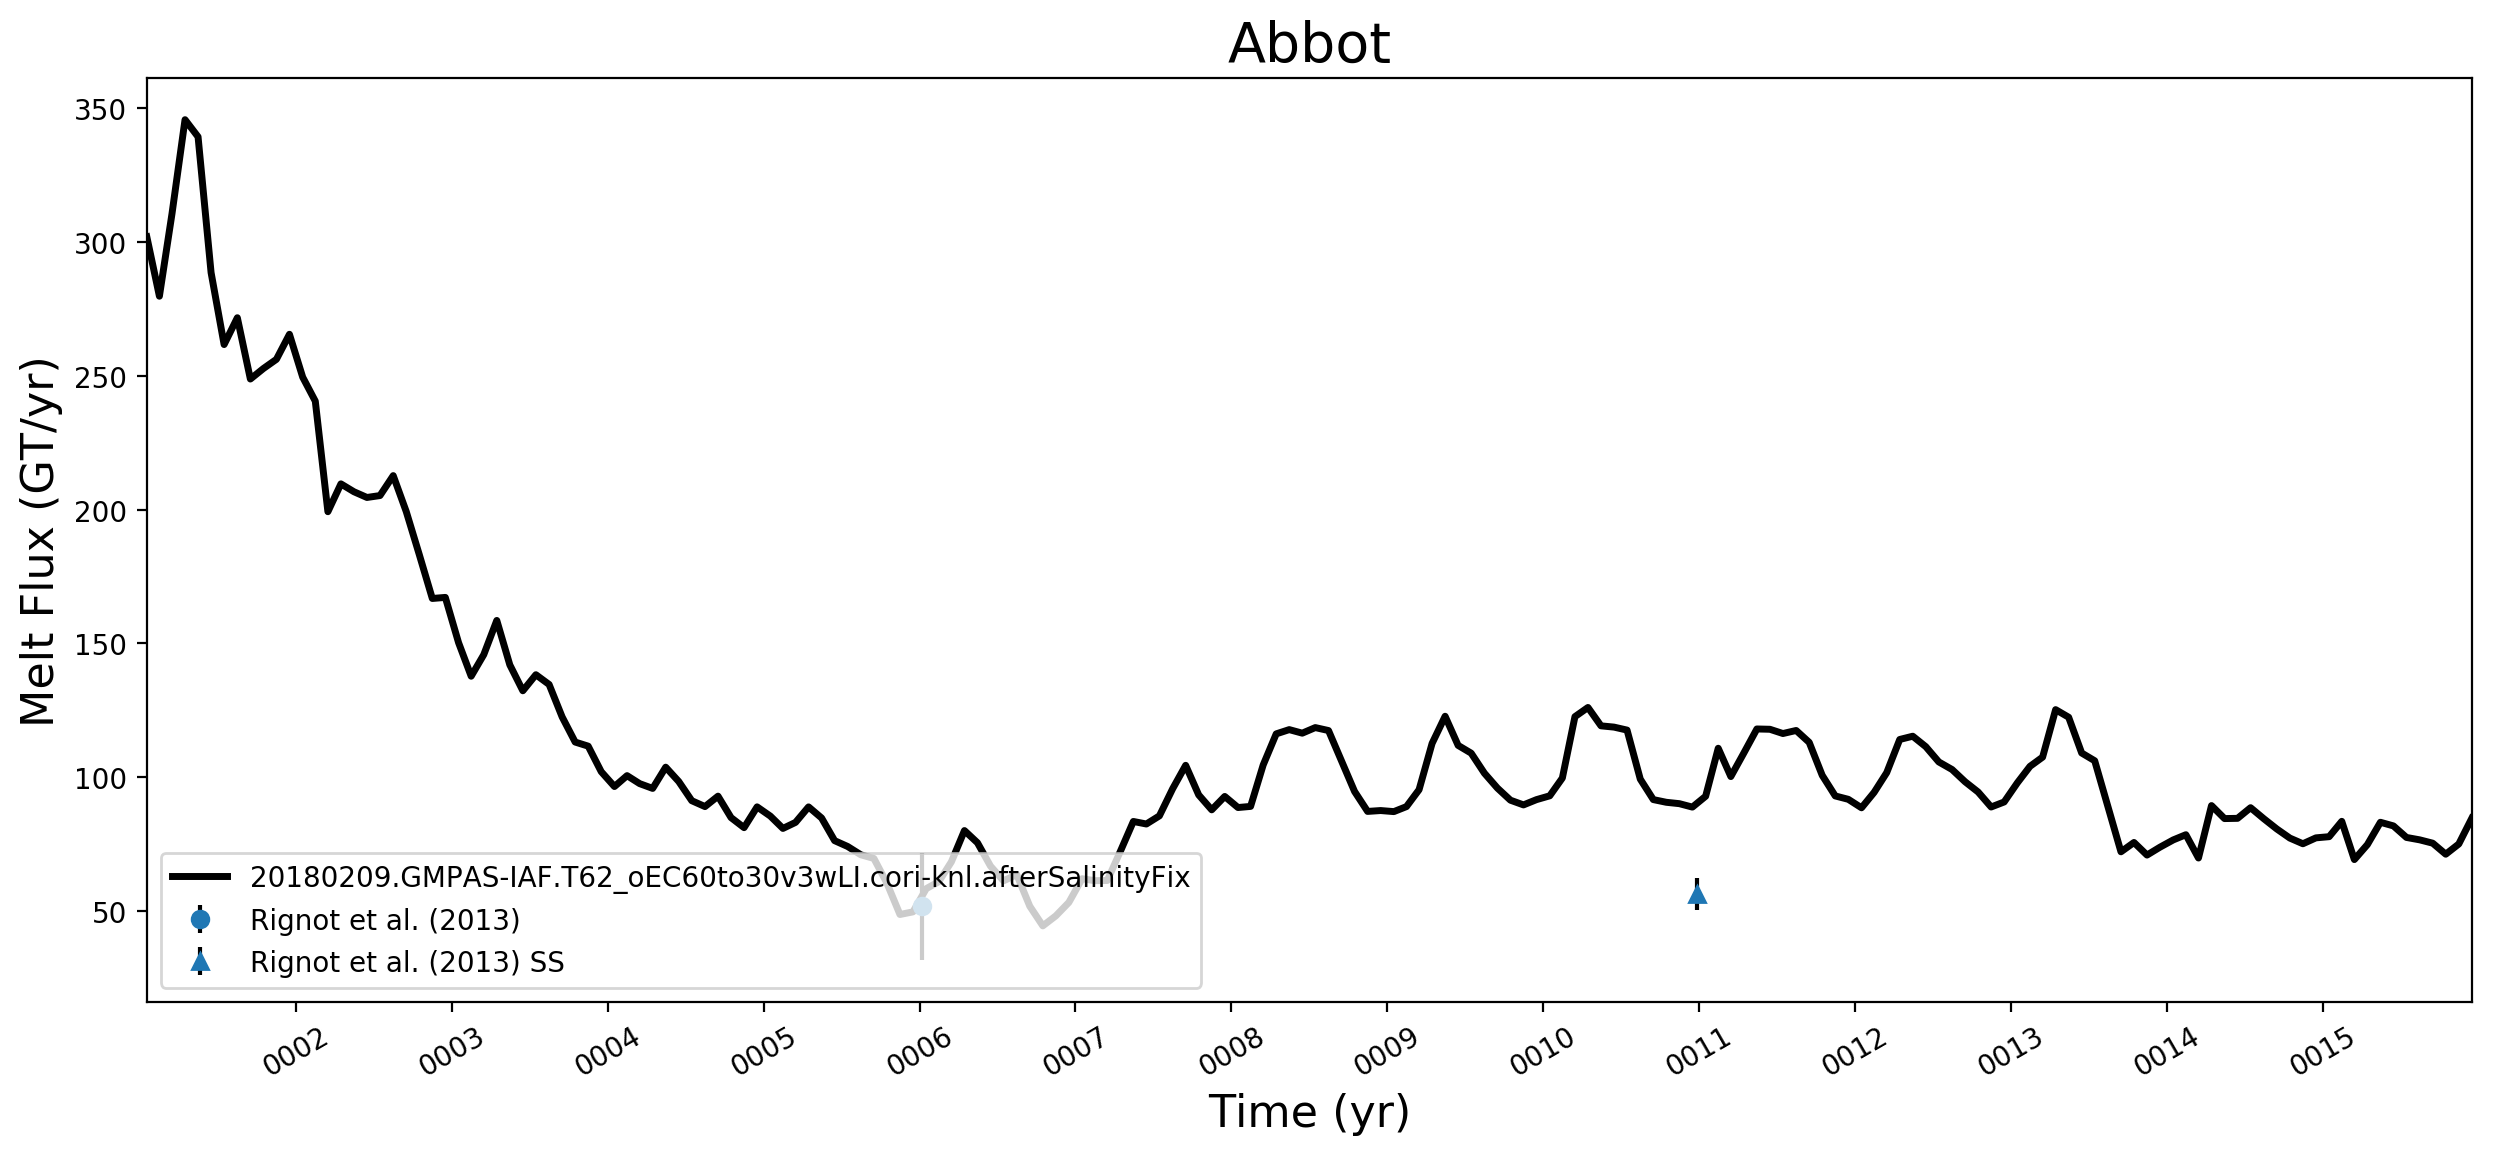
Abbot

George VI
Area-averaged Melt Rate
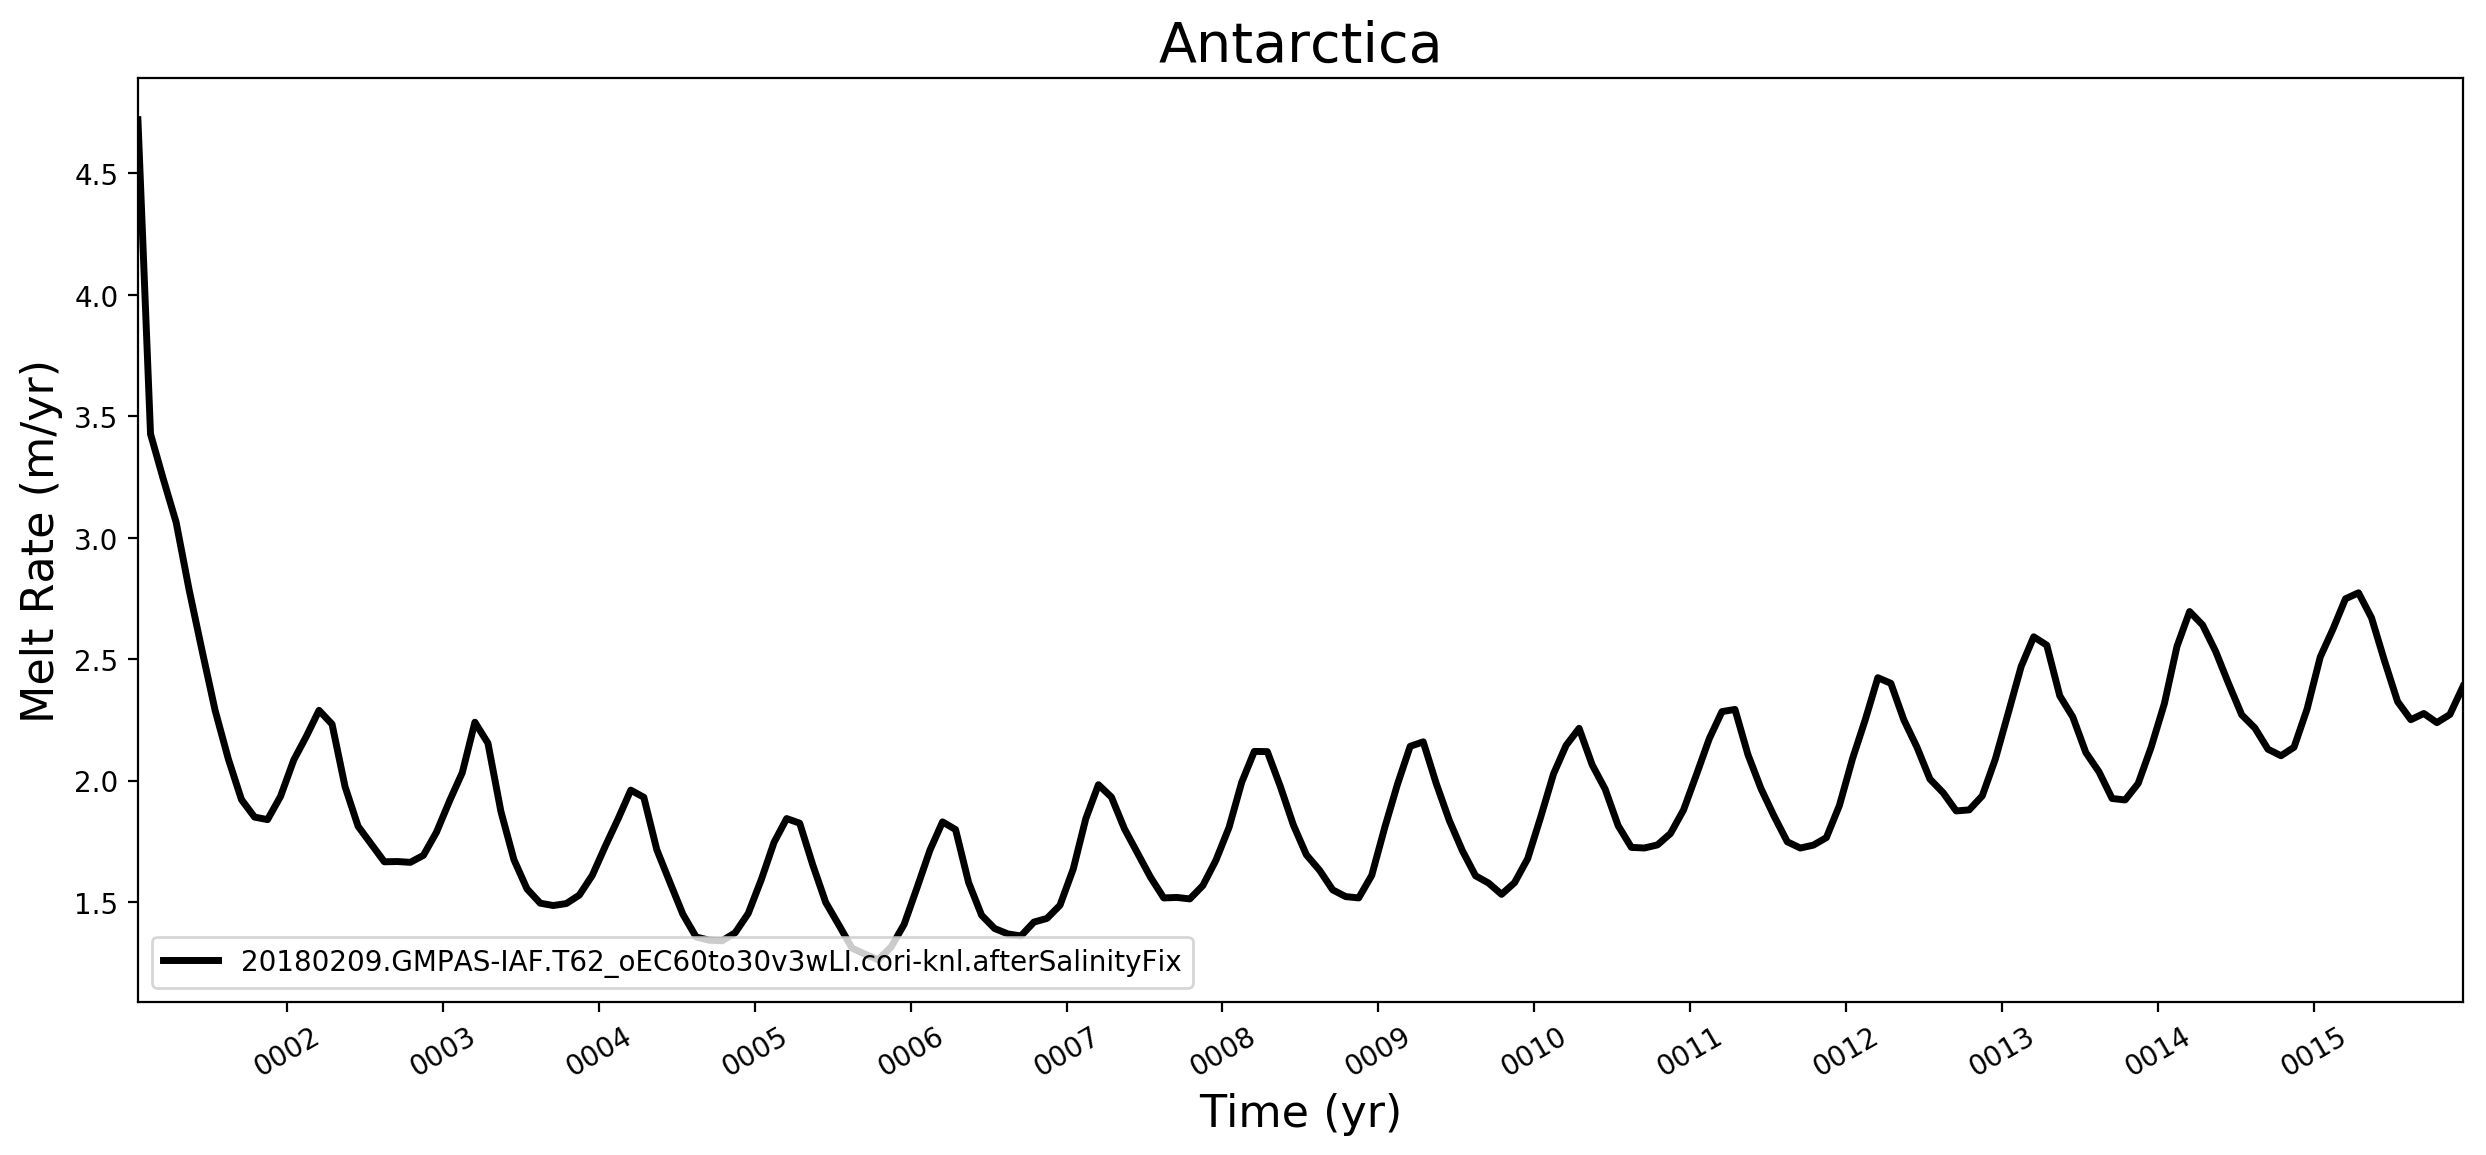
Antarctica
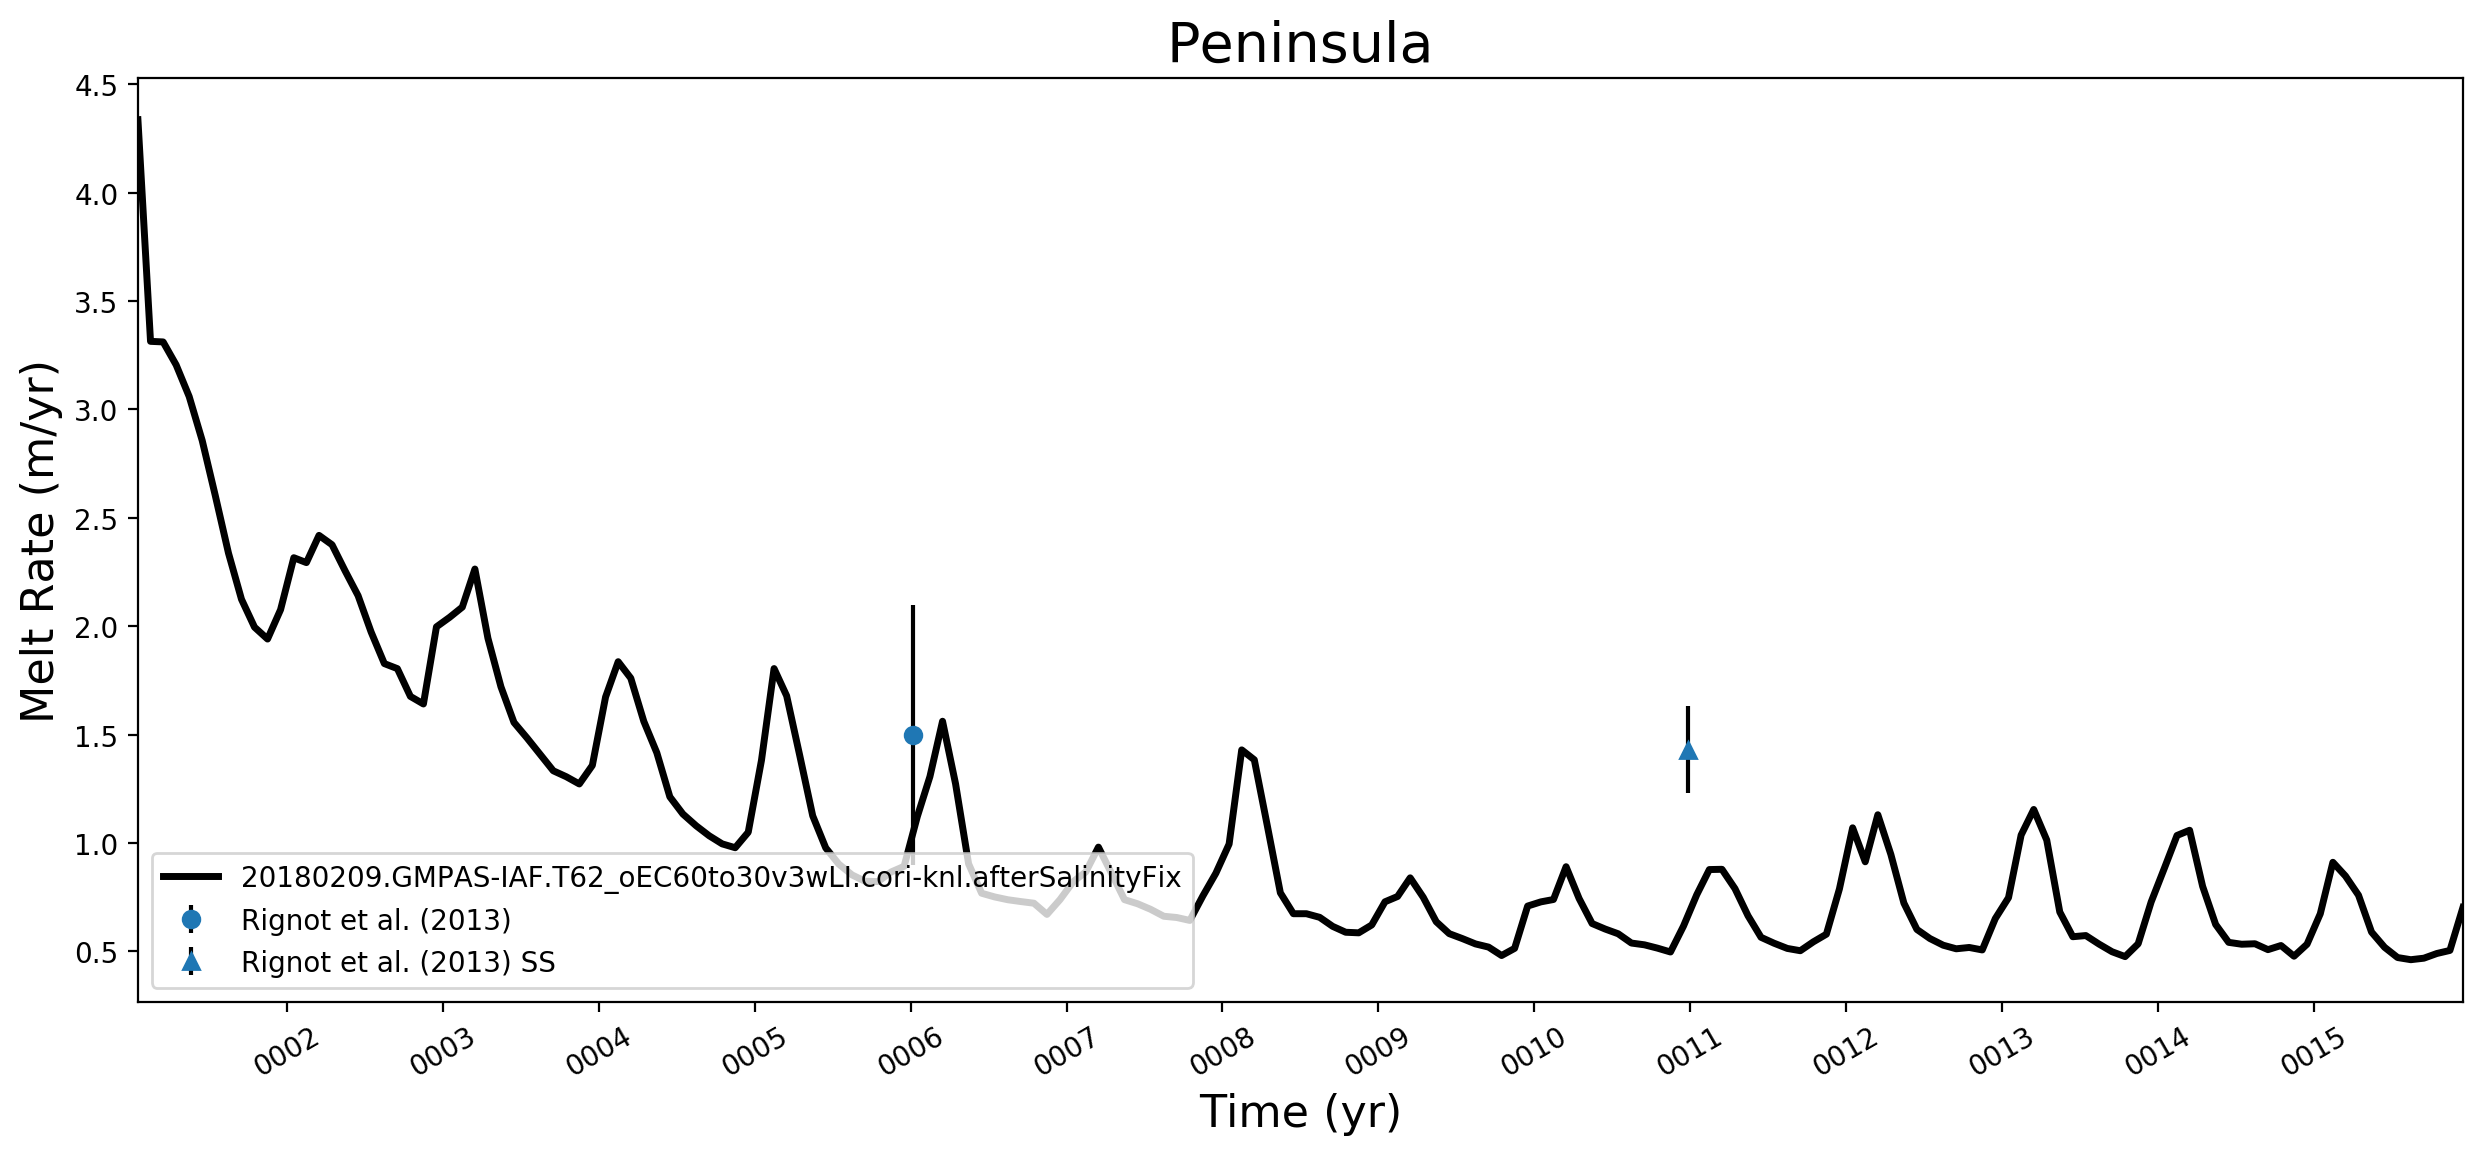
Peninsula
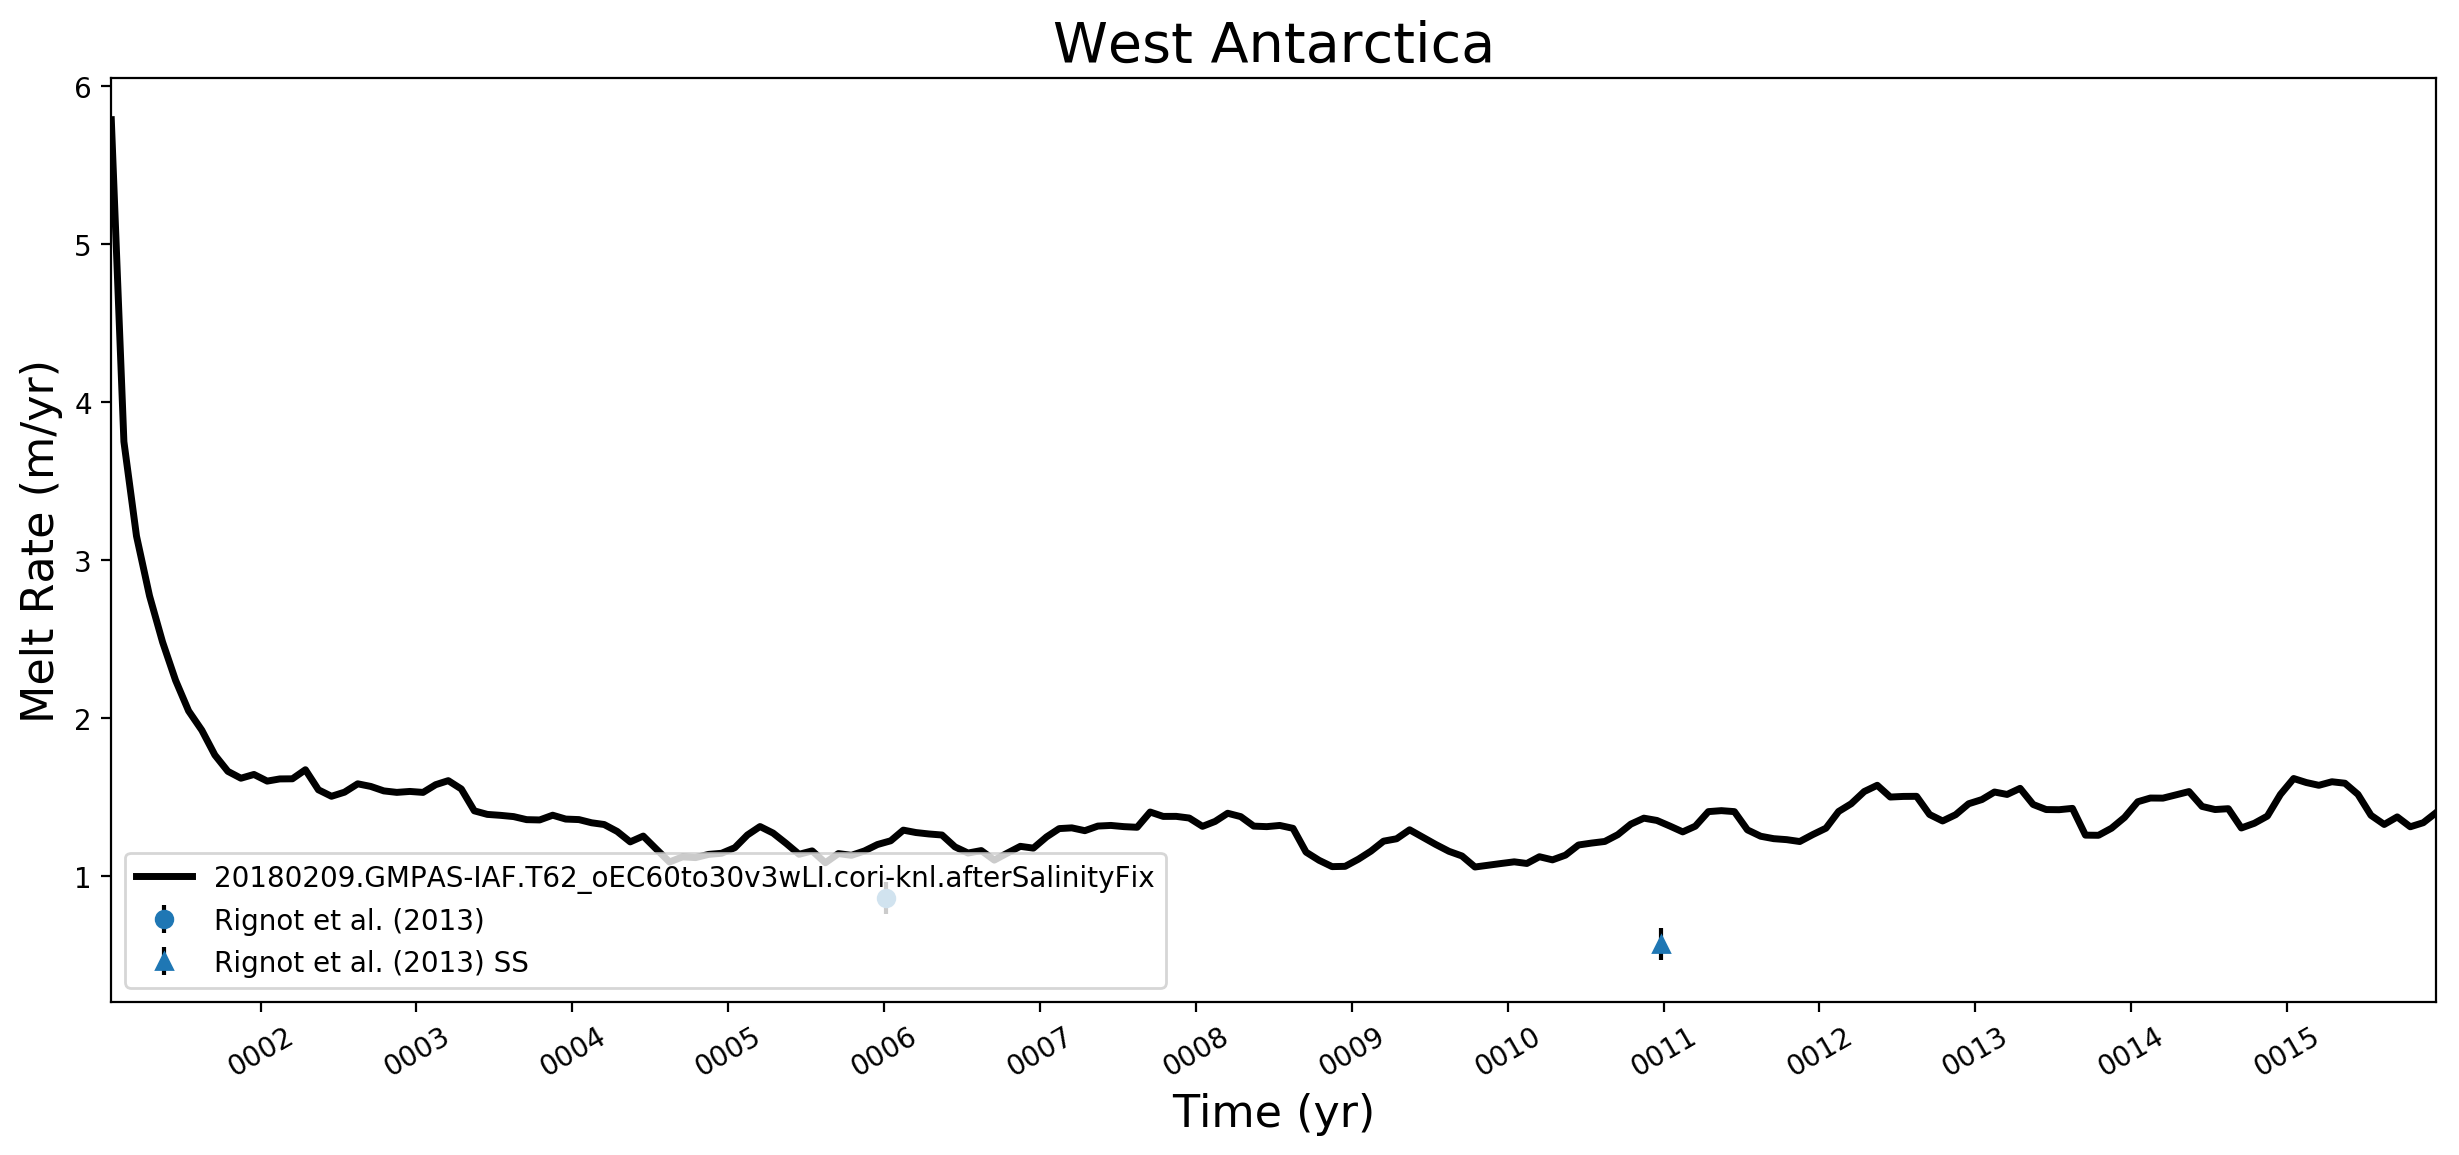
West Antarctica
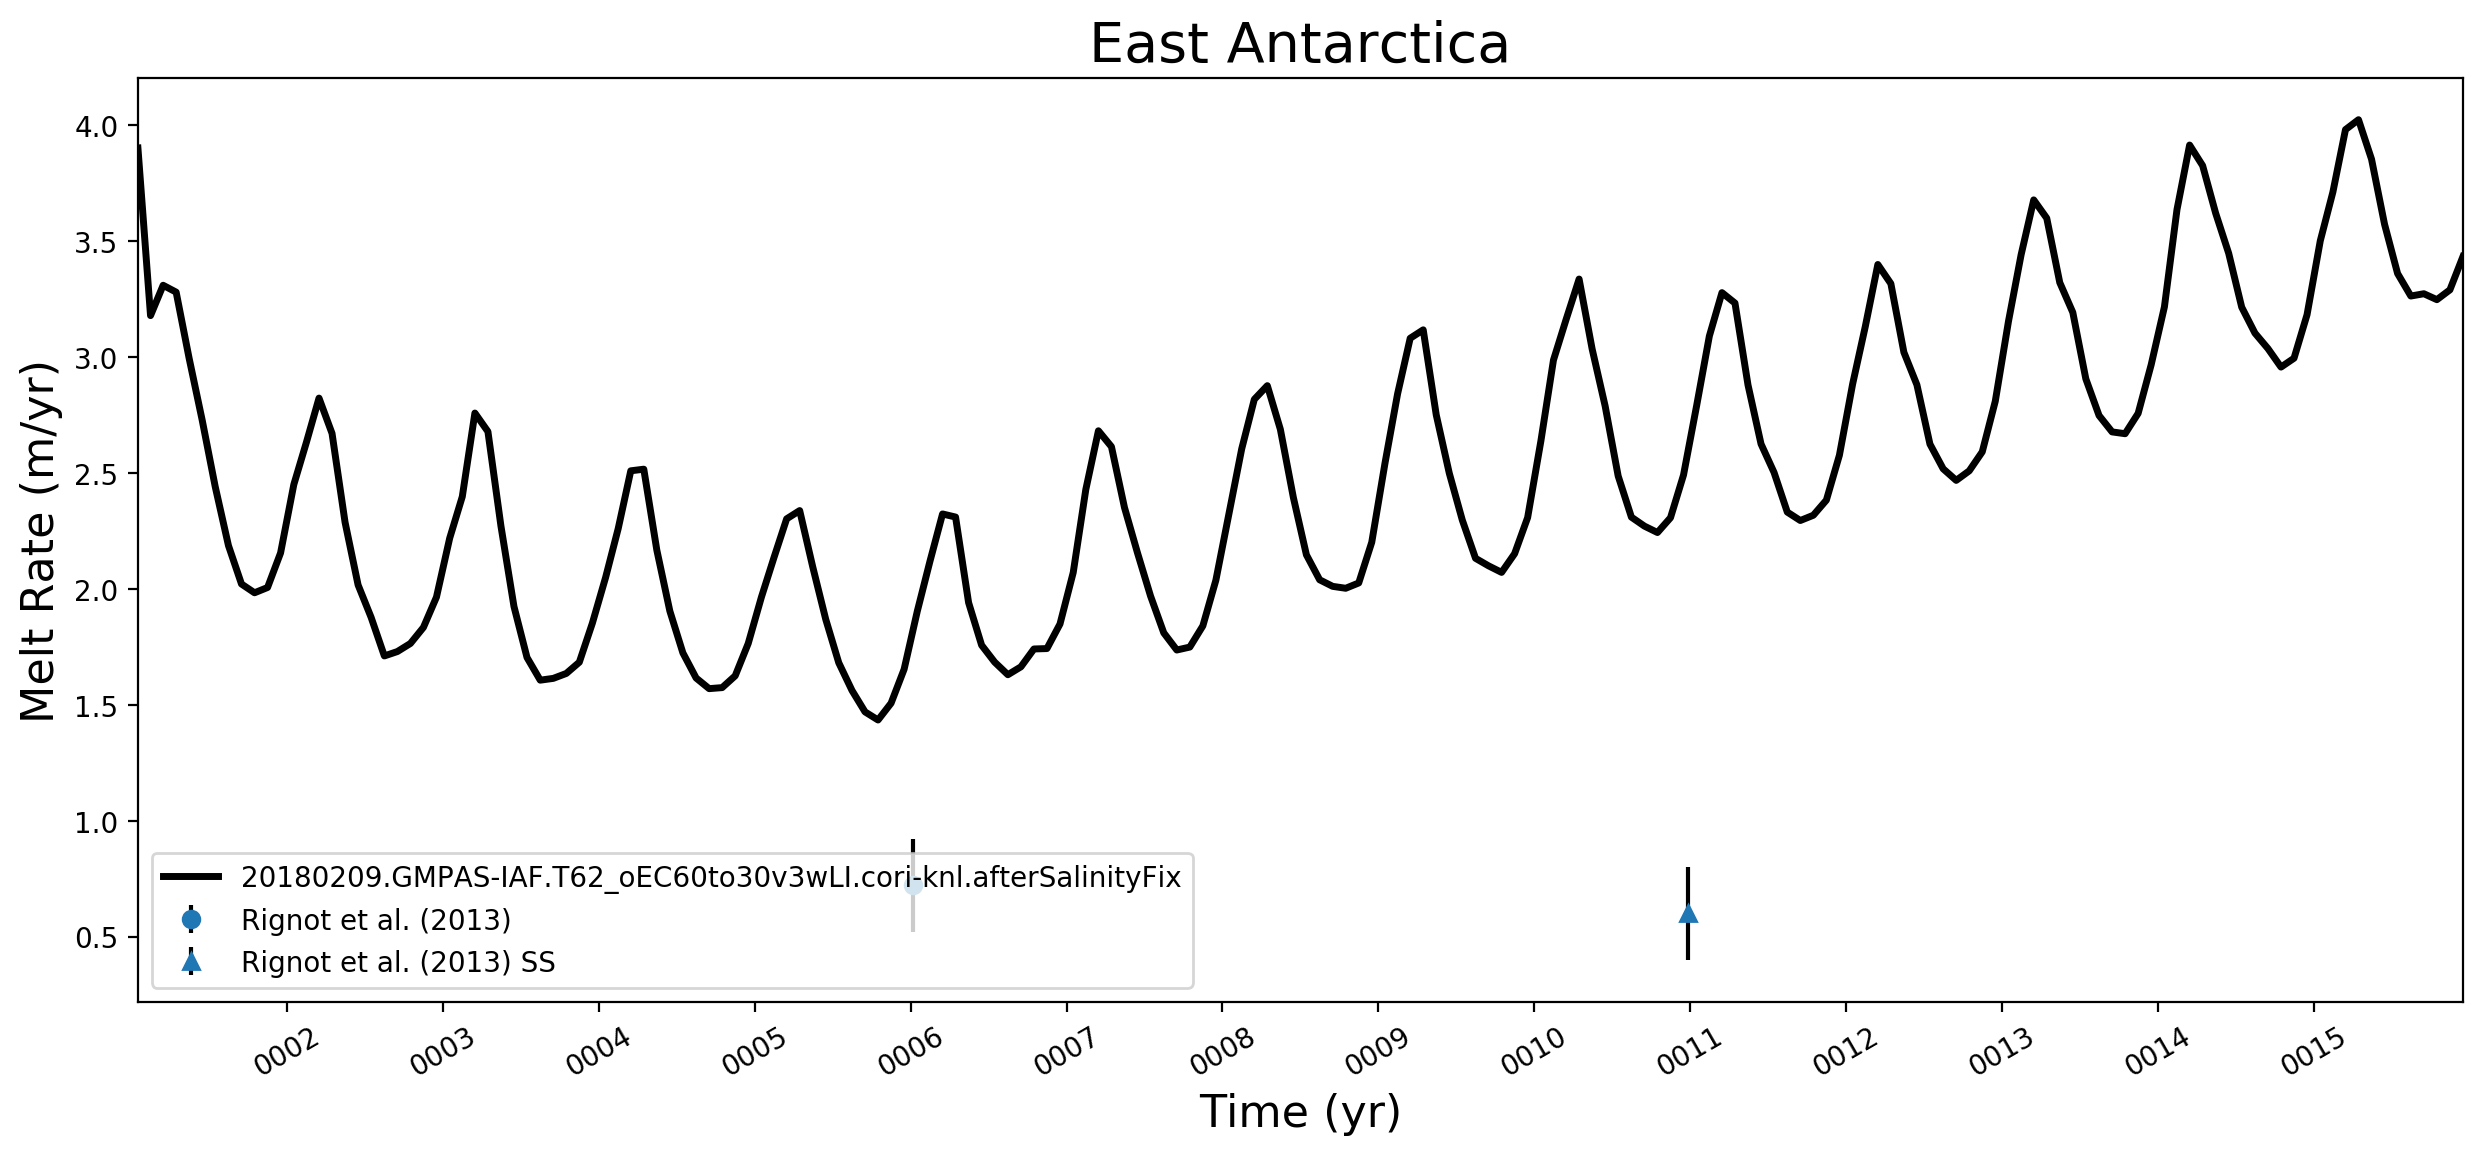
East Antarctica
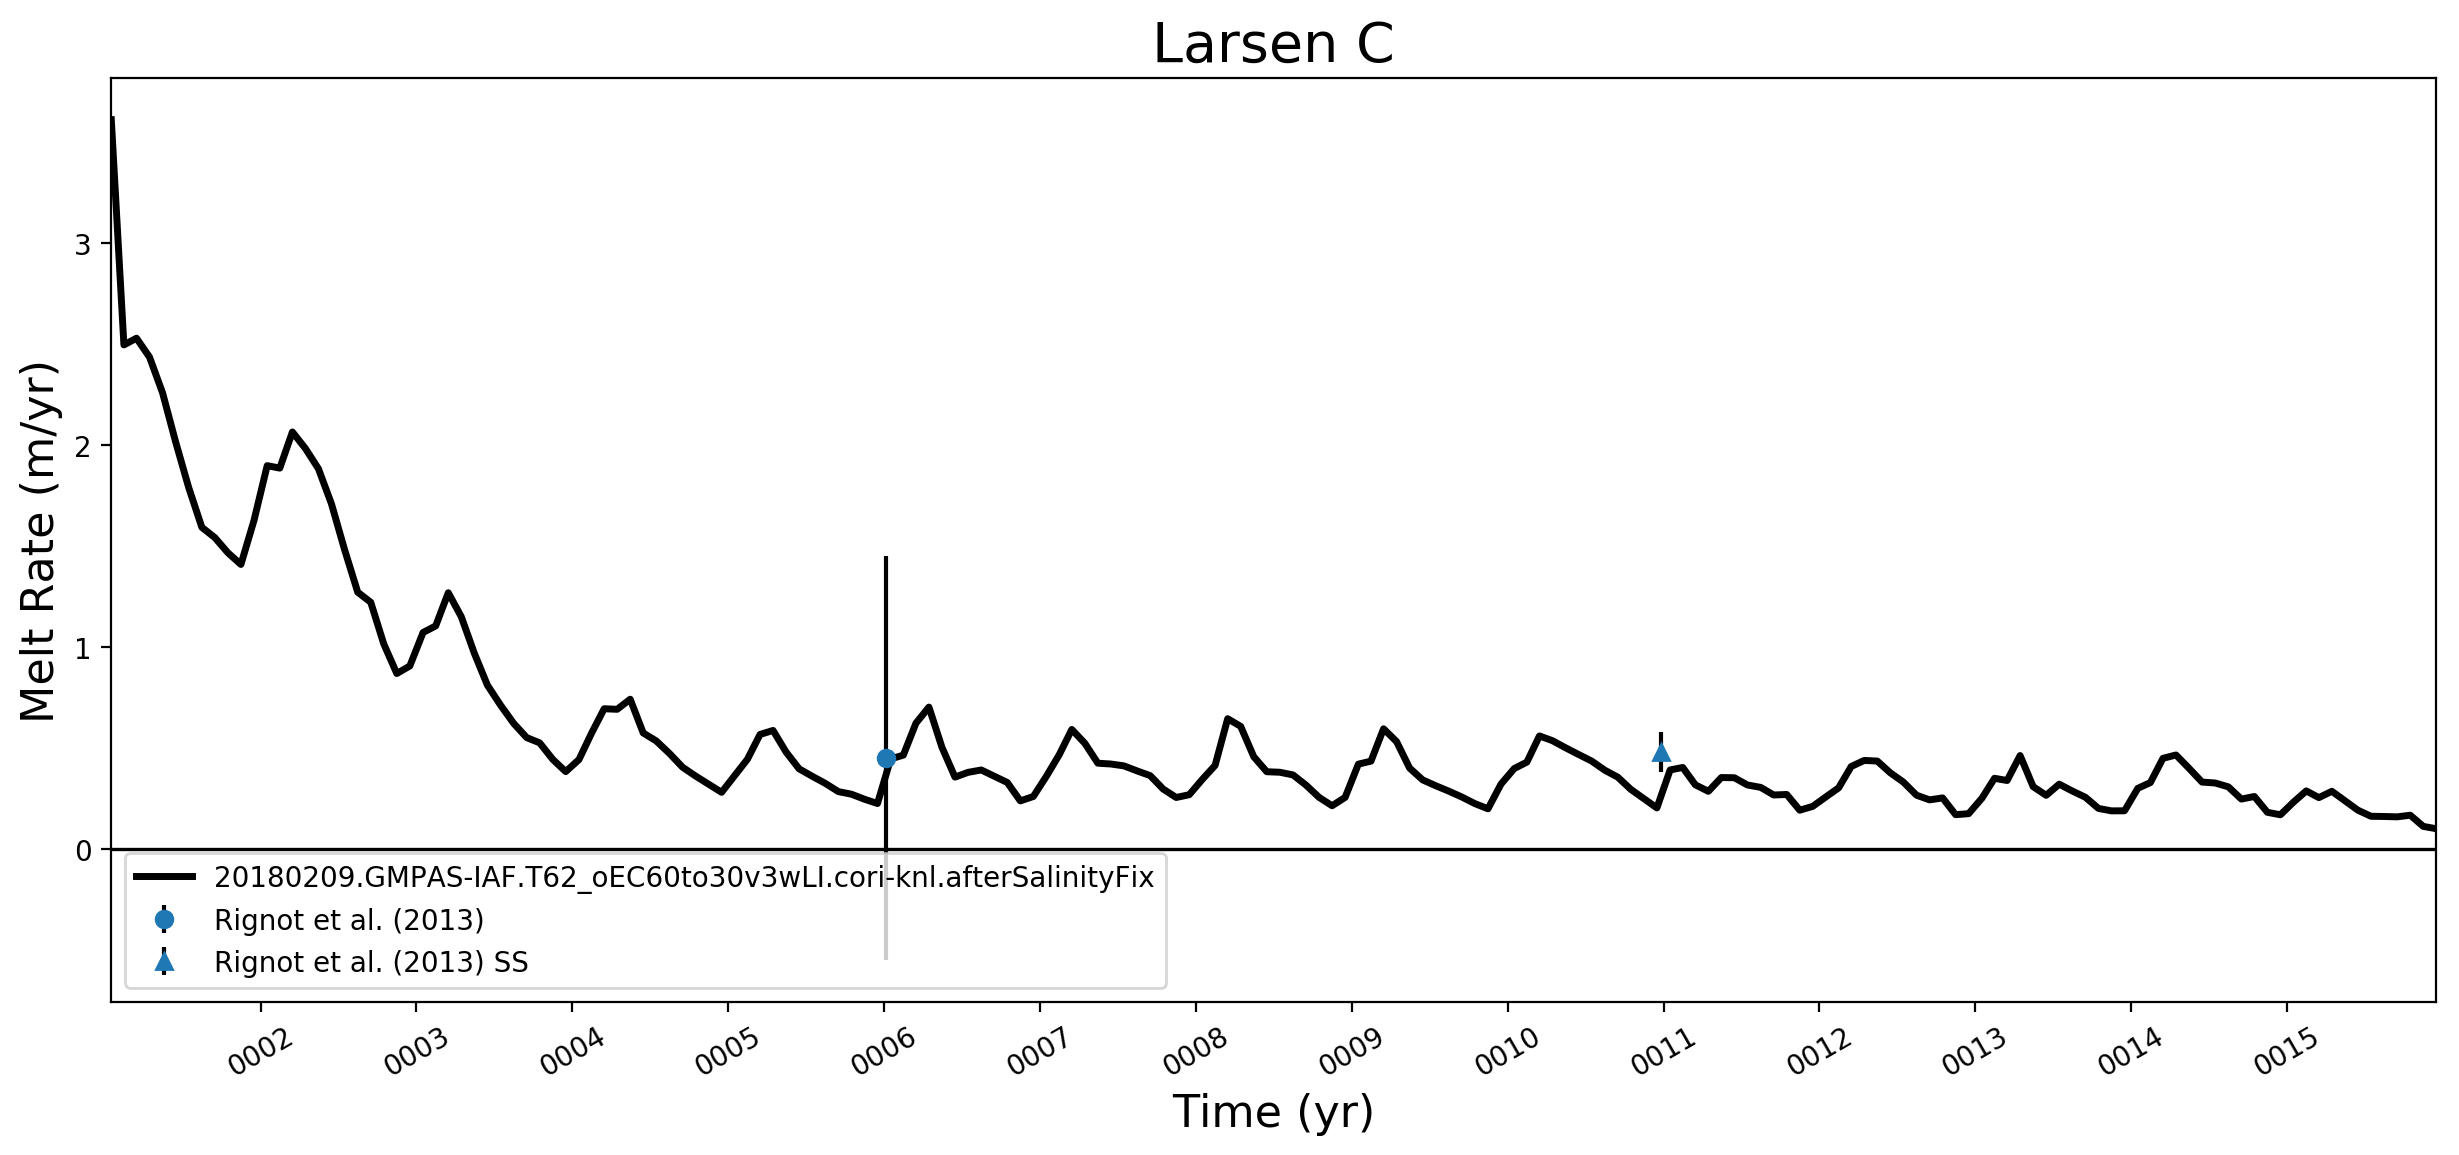
Larsen C
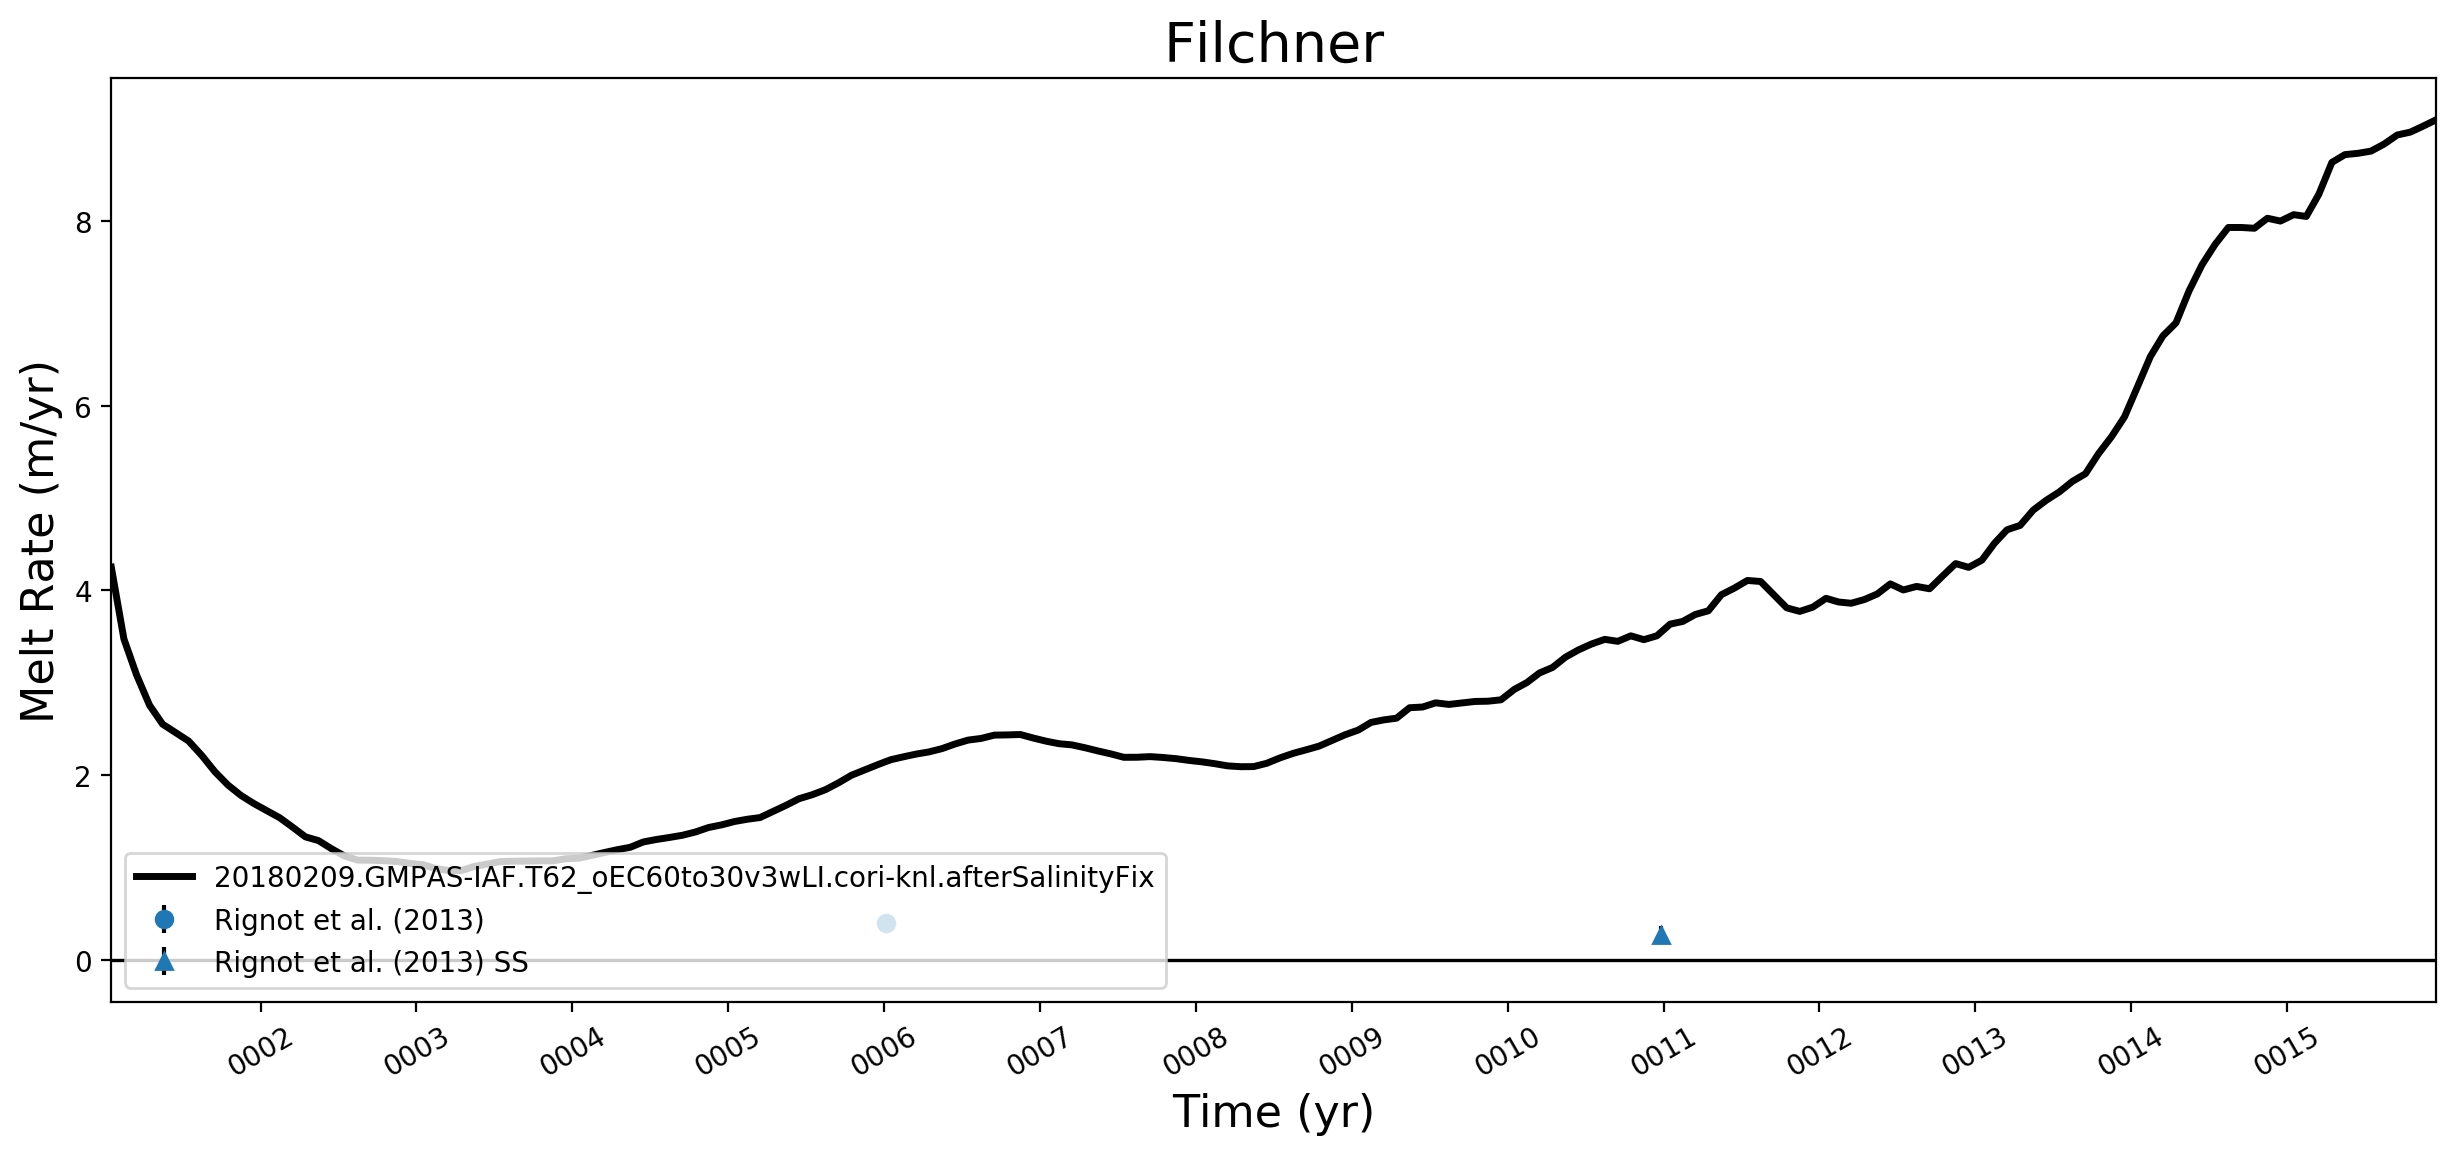
Filchner
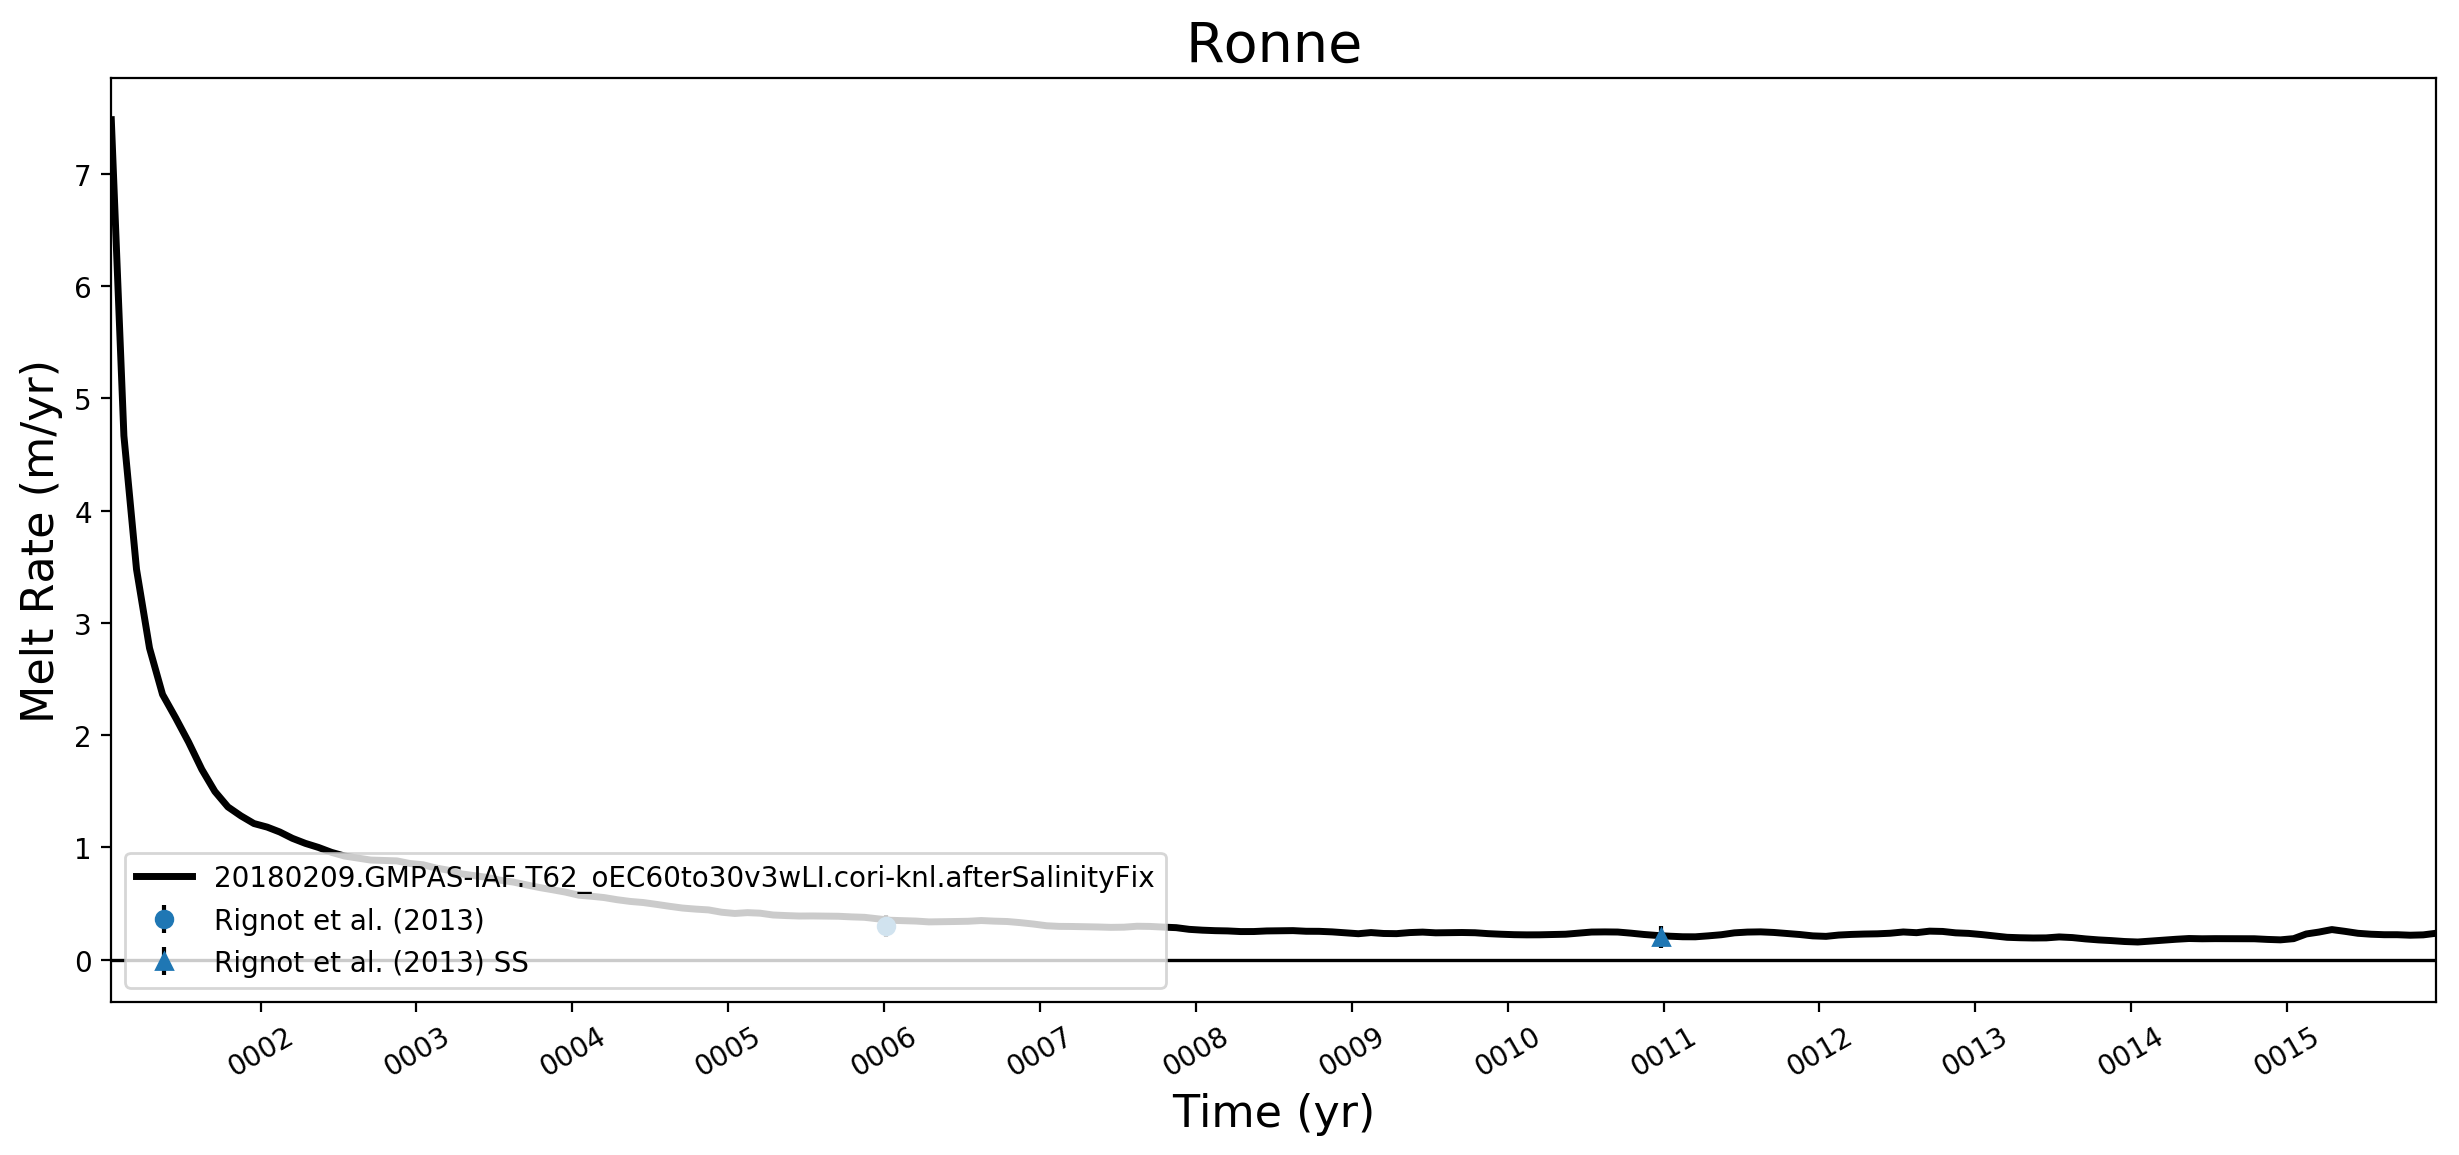
Ronne
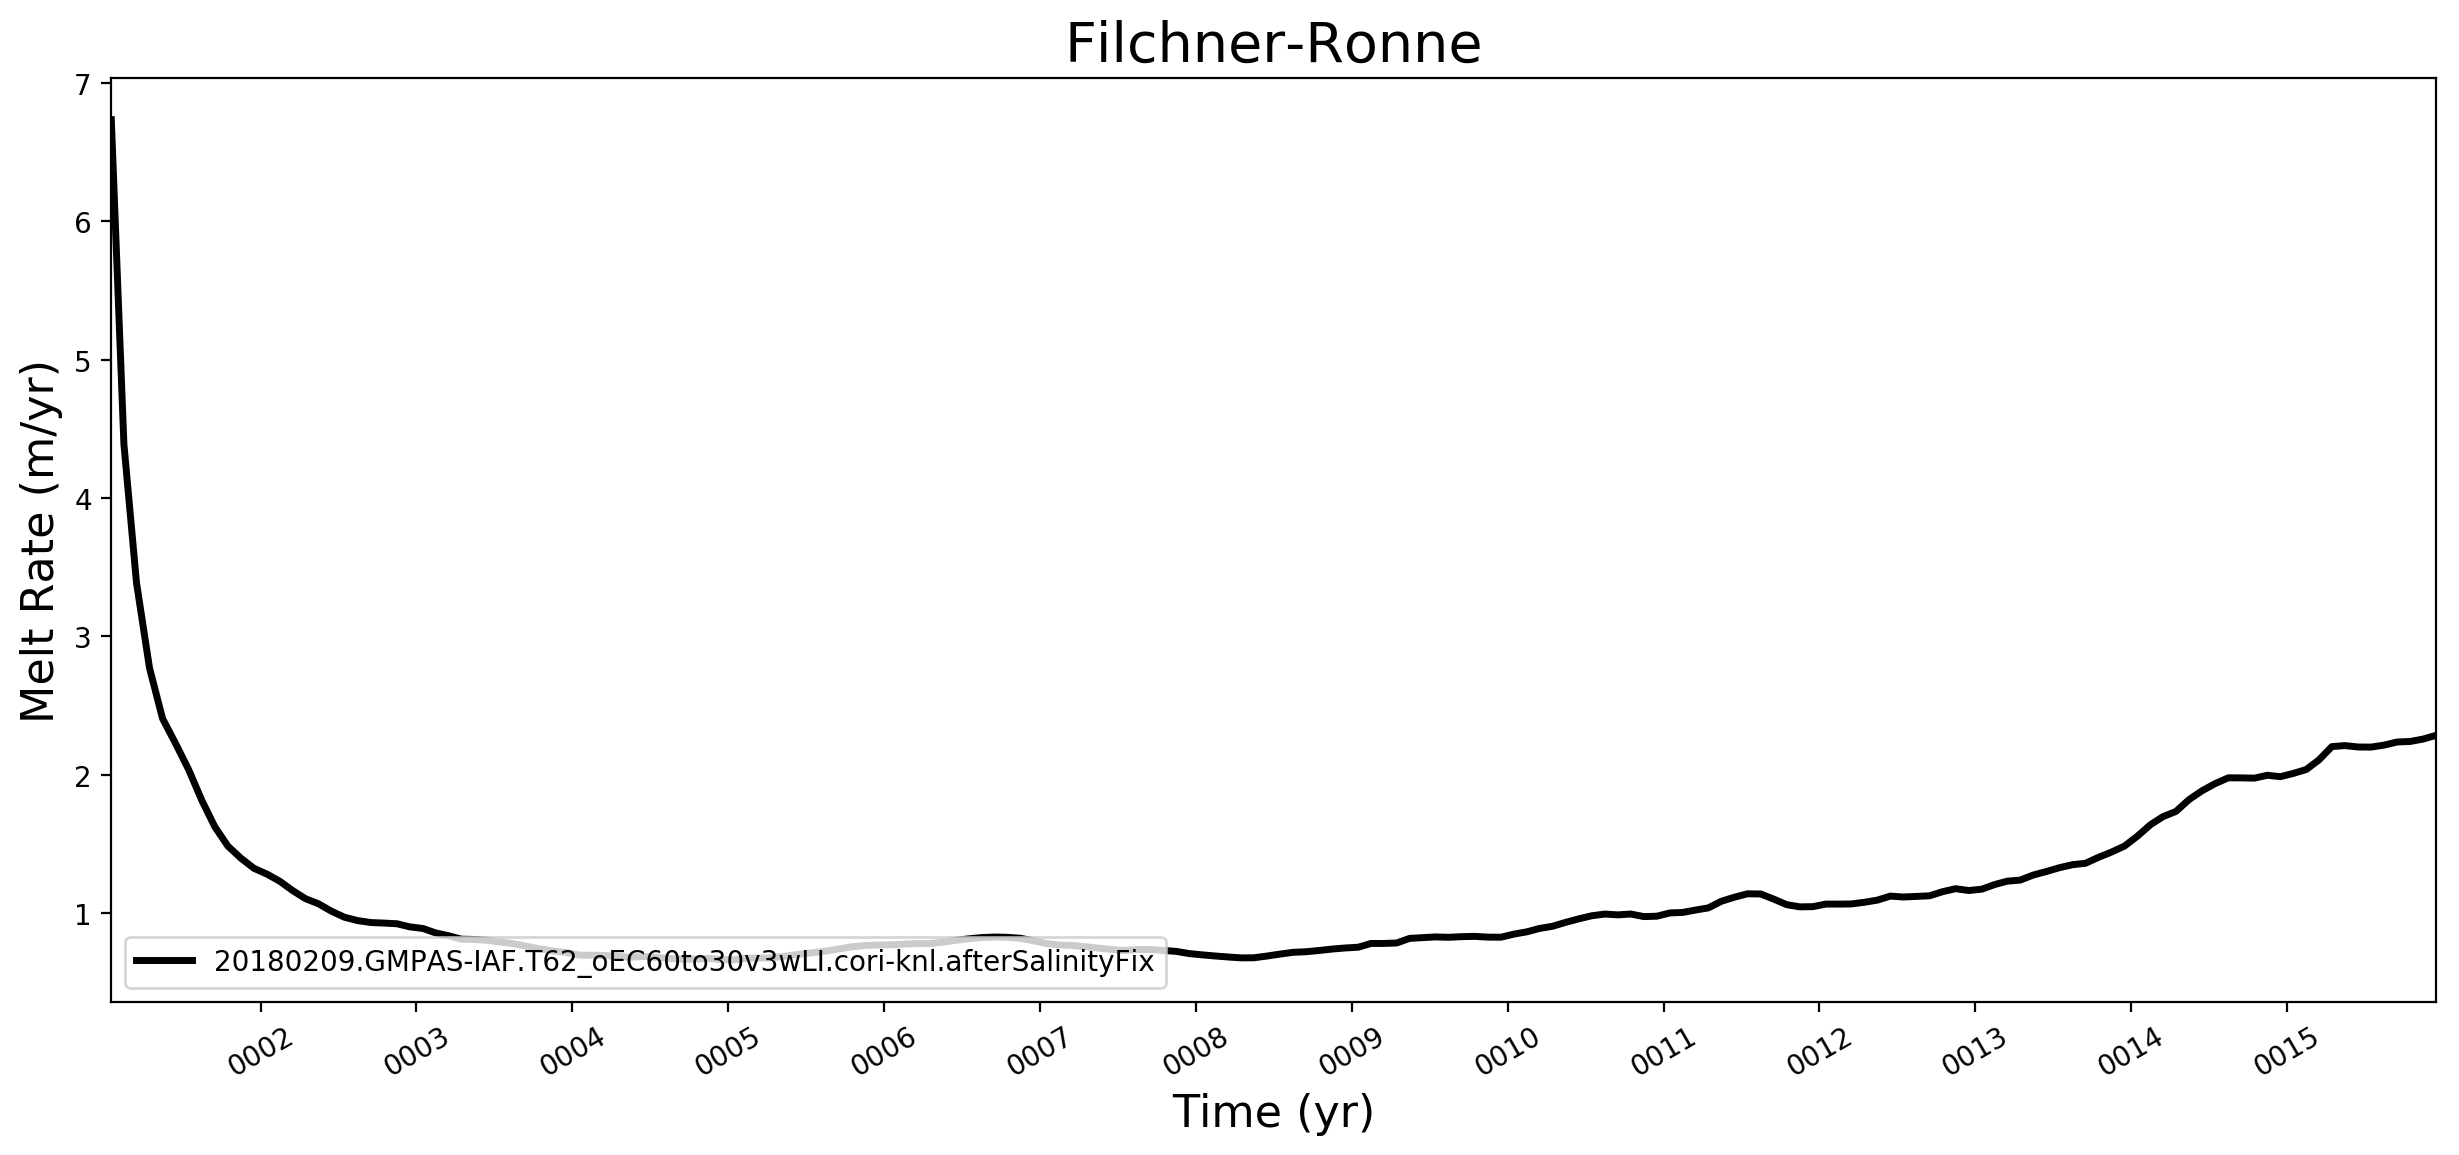
Filchner-Ronne
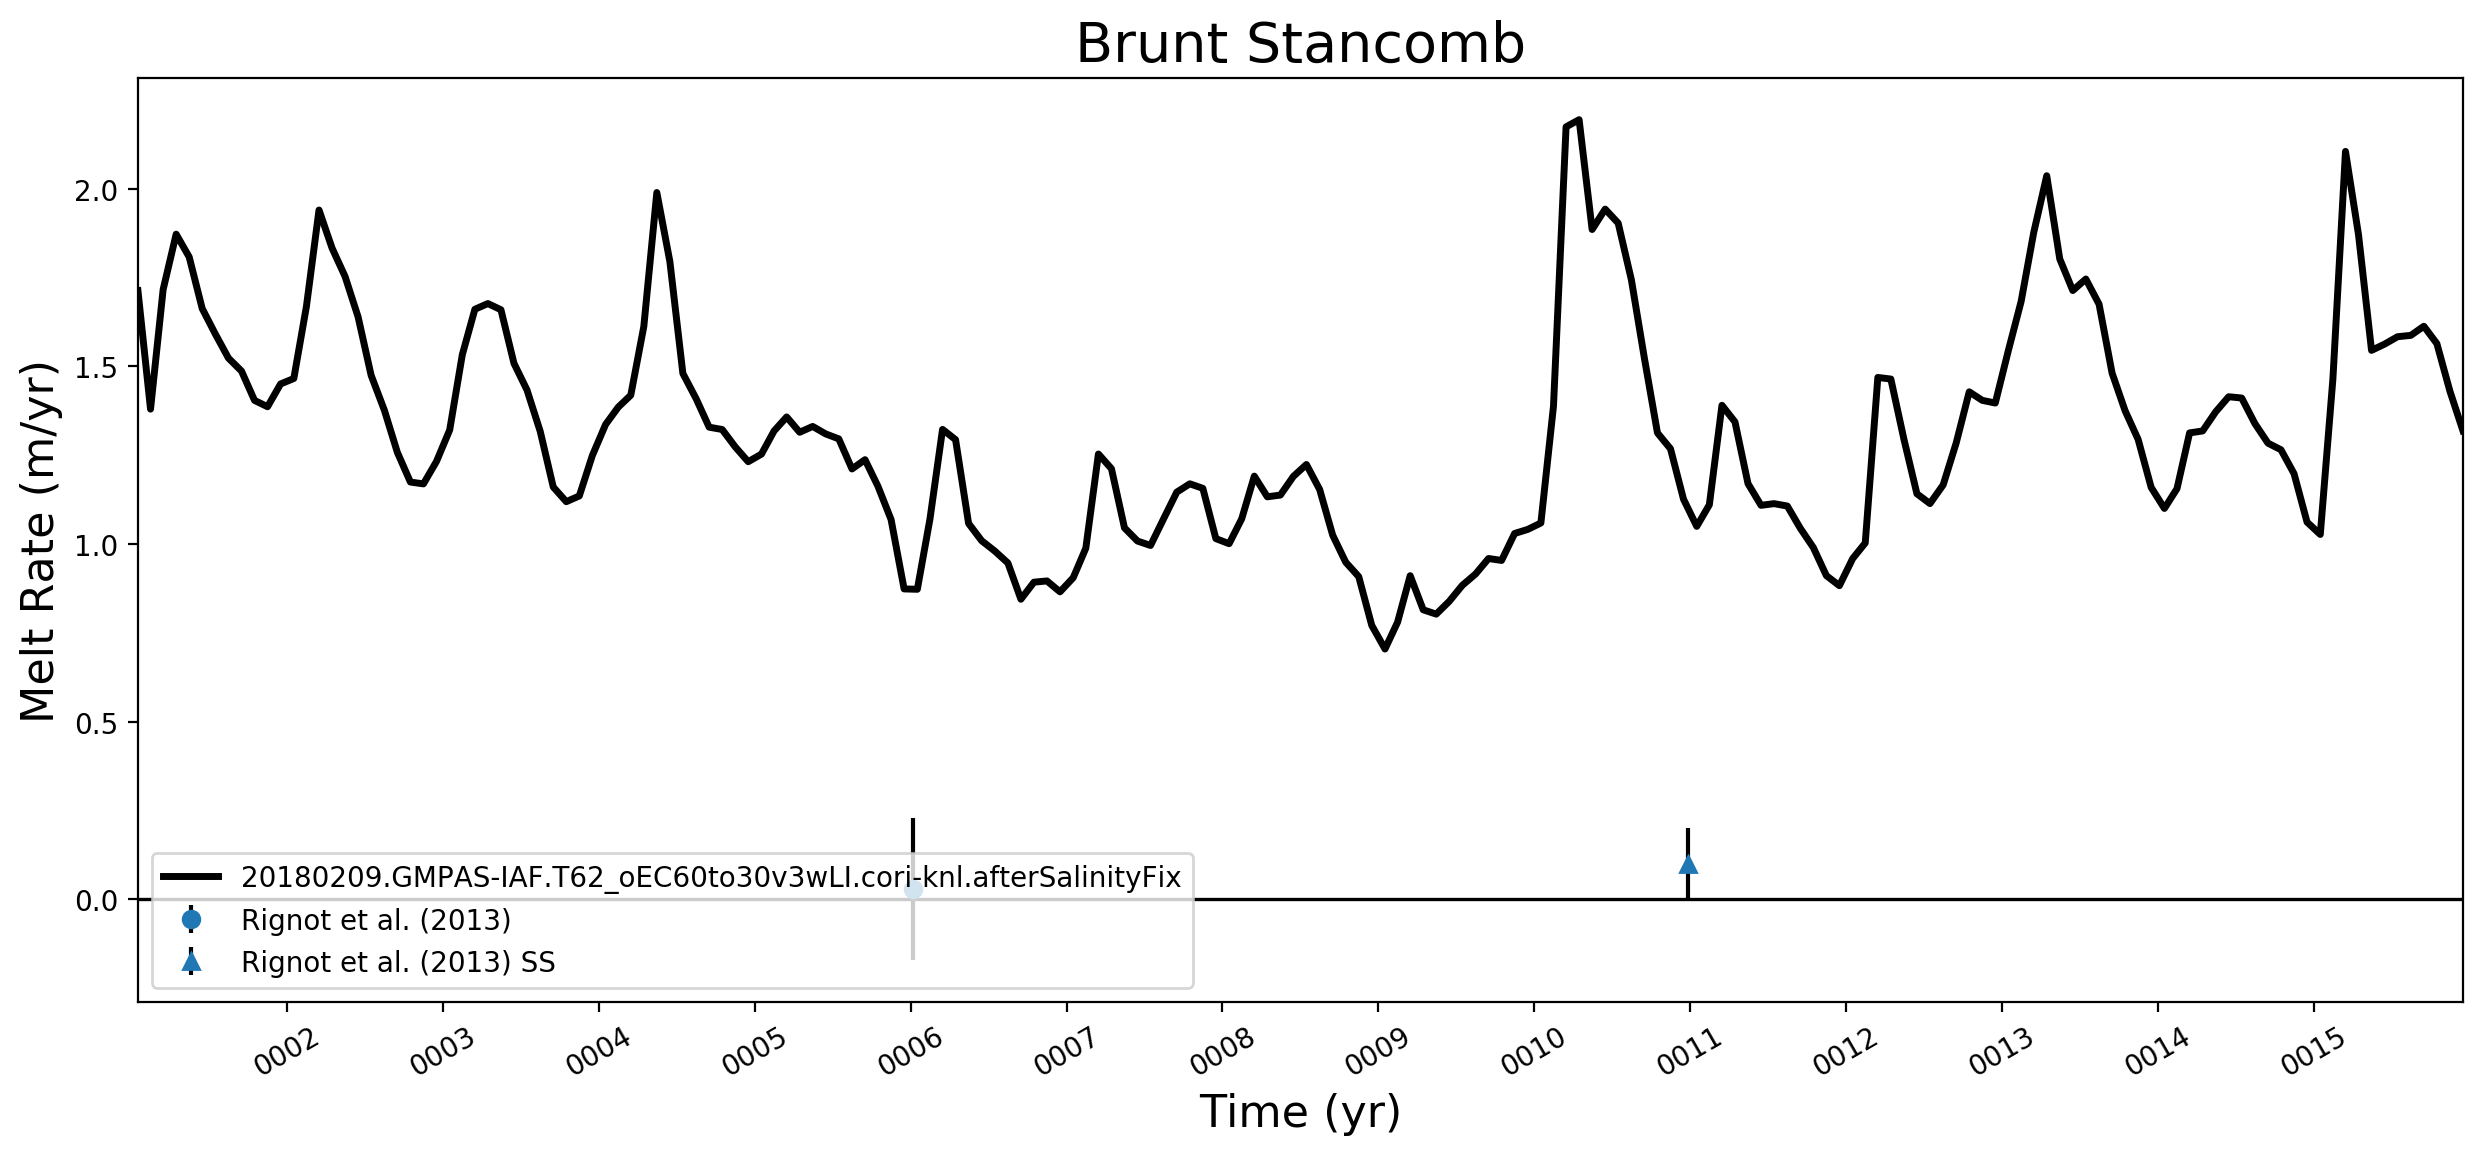
Brunt Stancomb
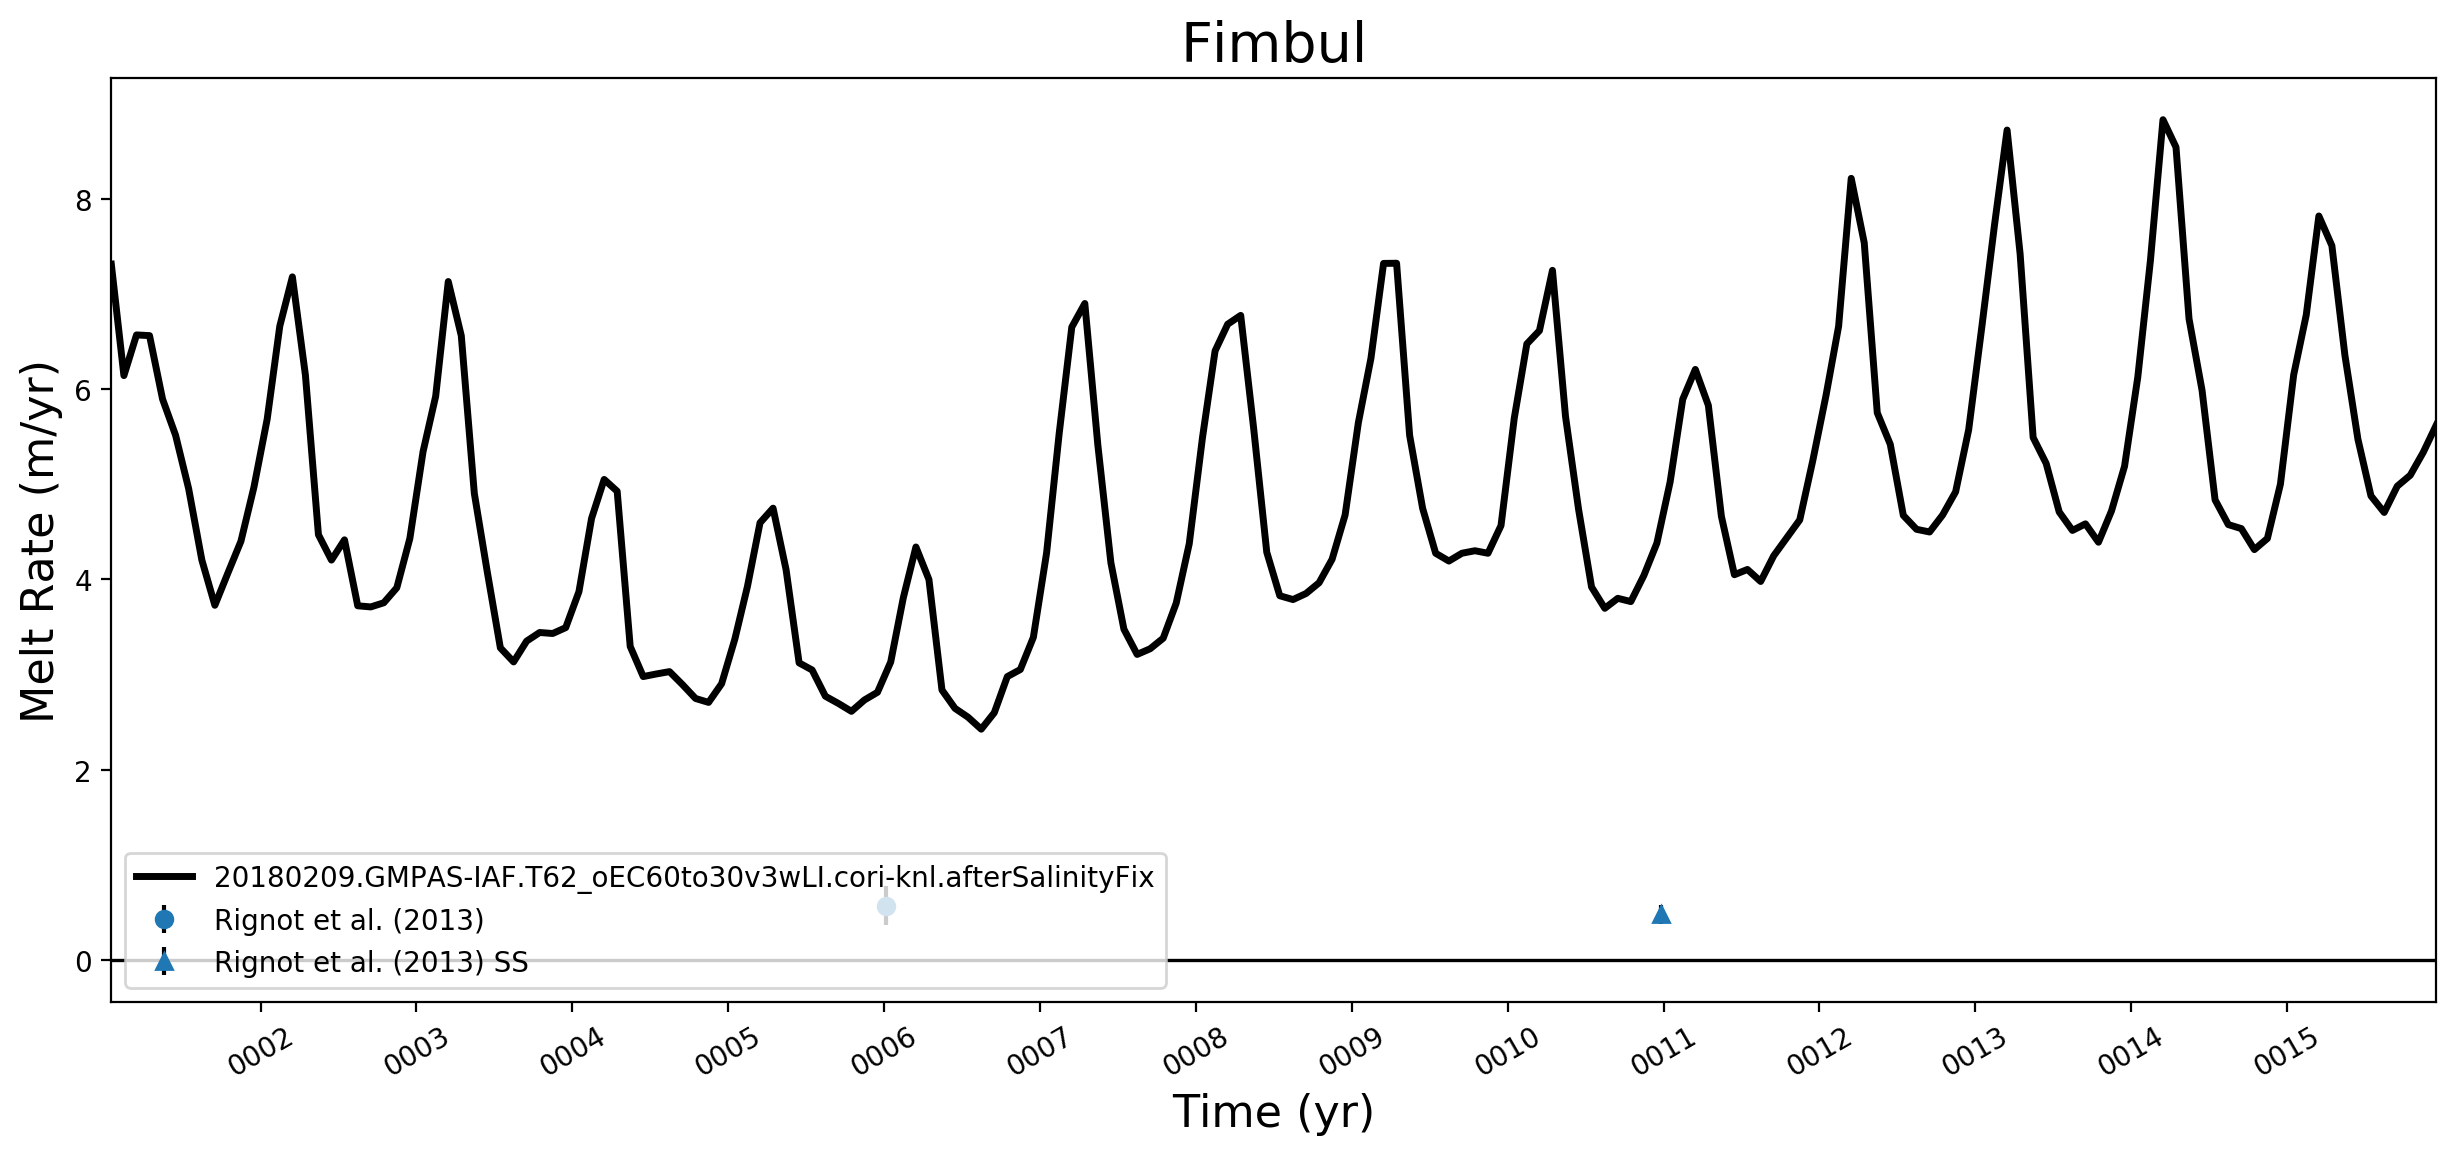
Fimbul
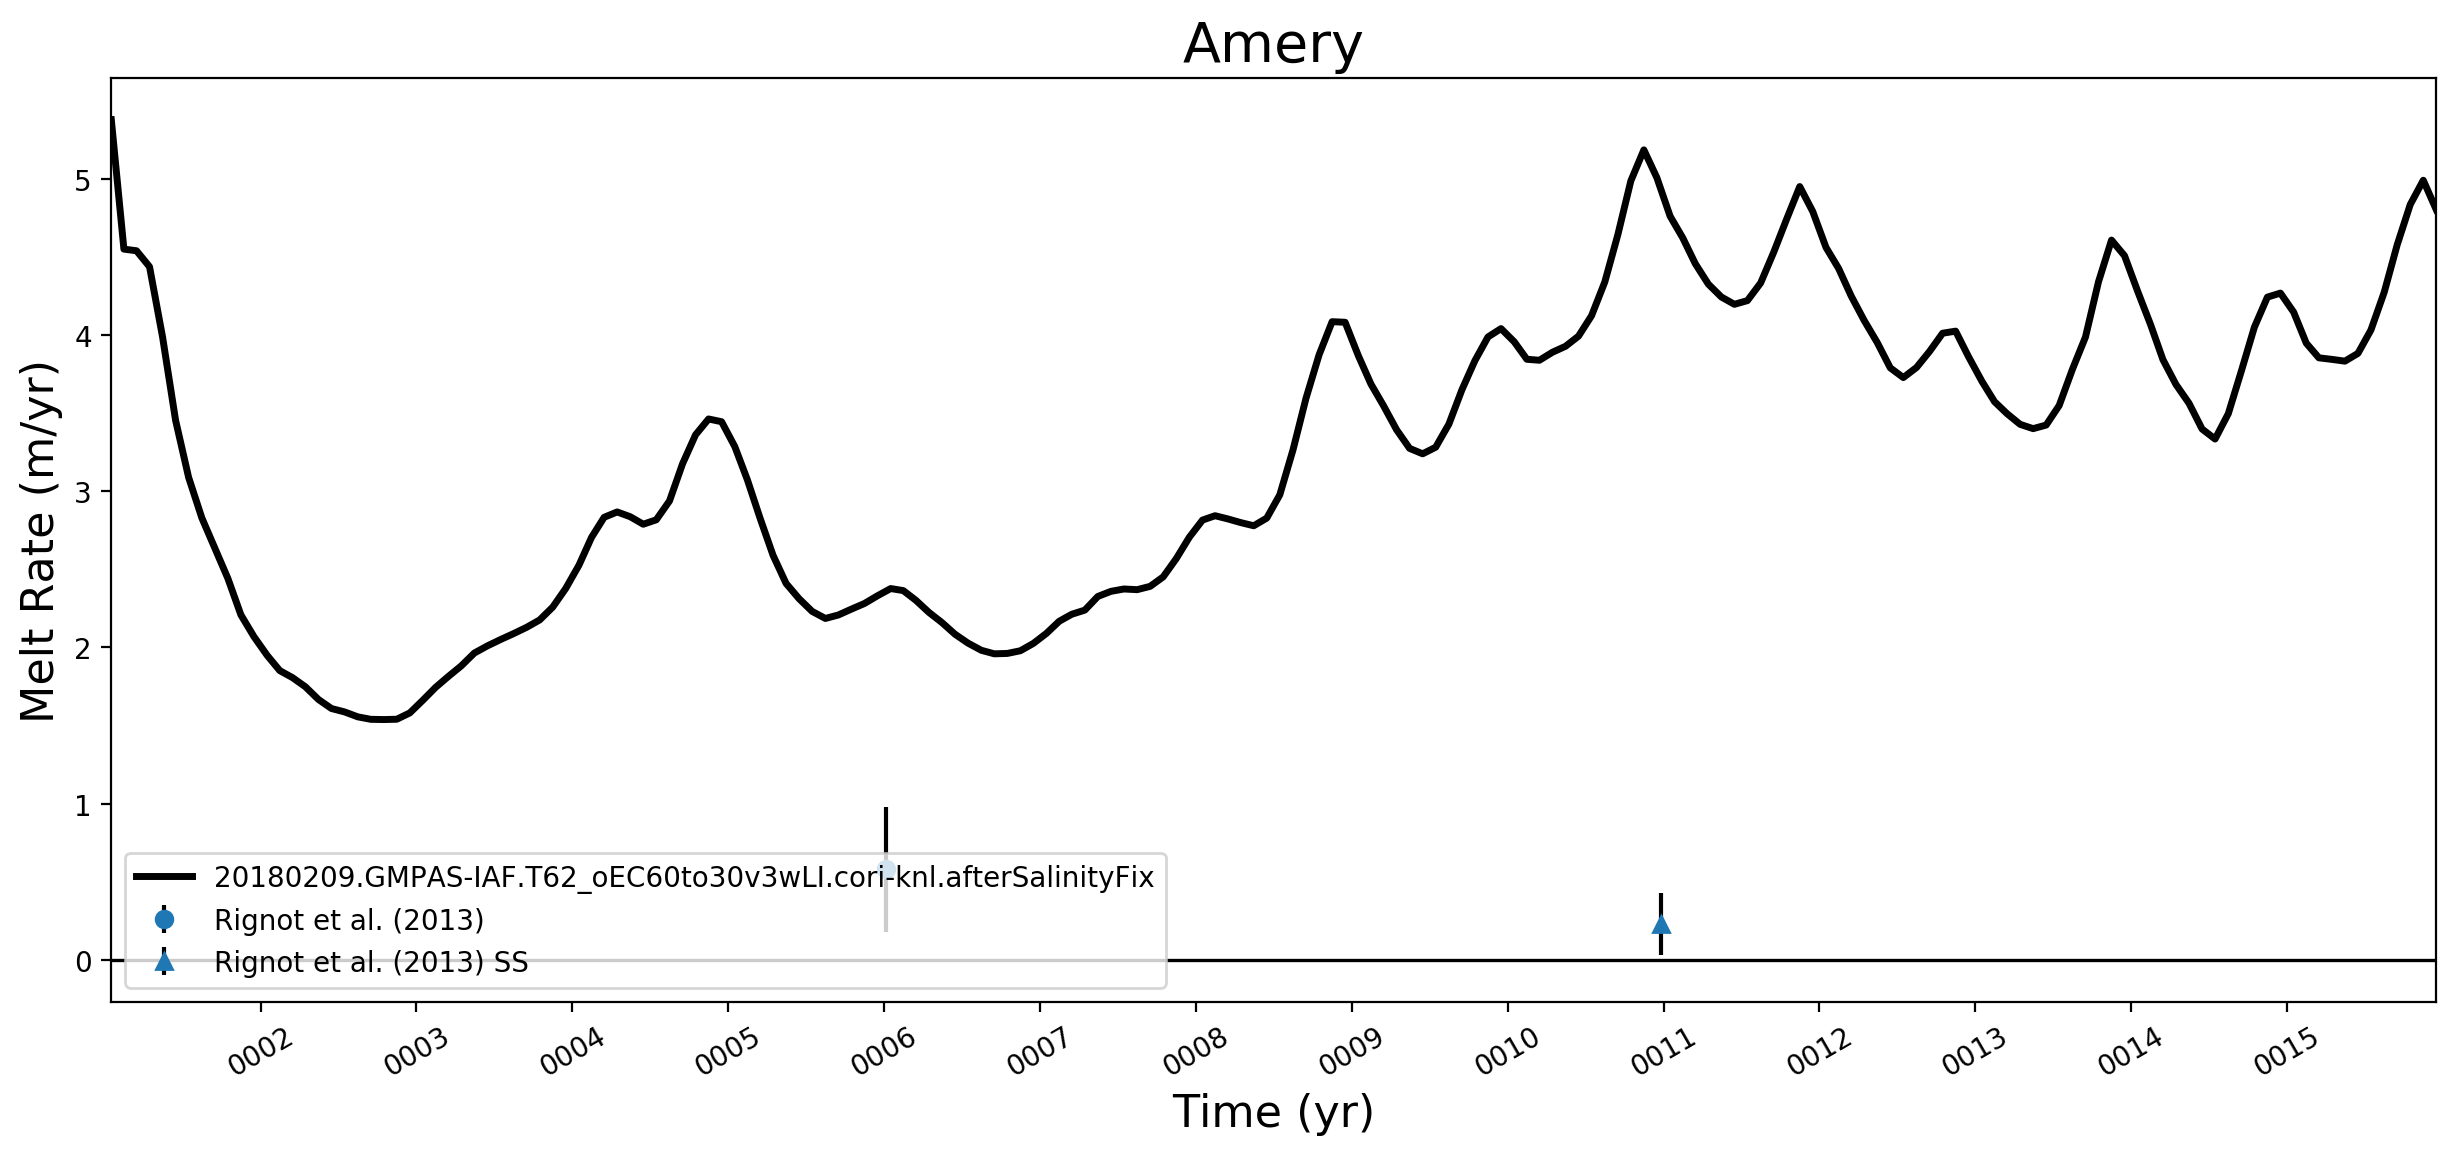
Amery
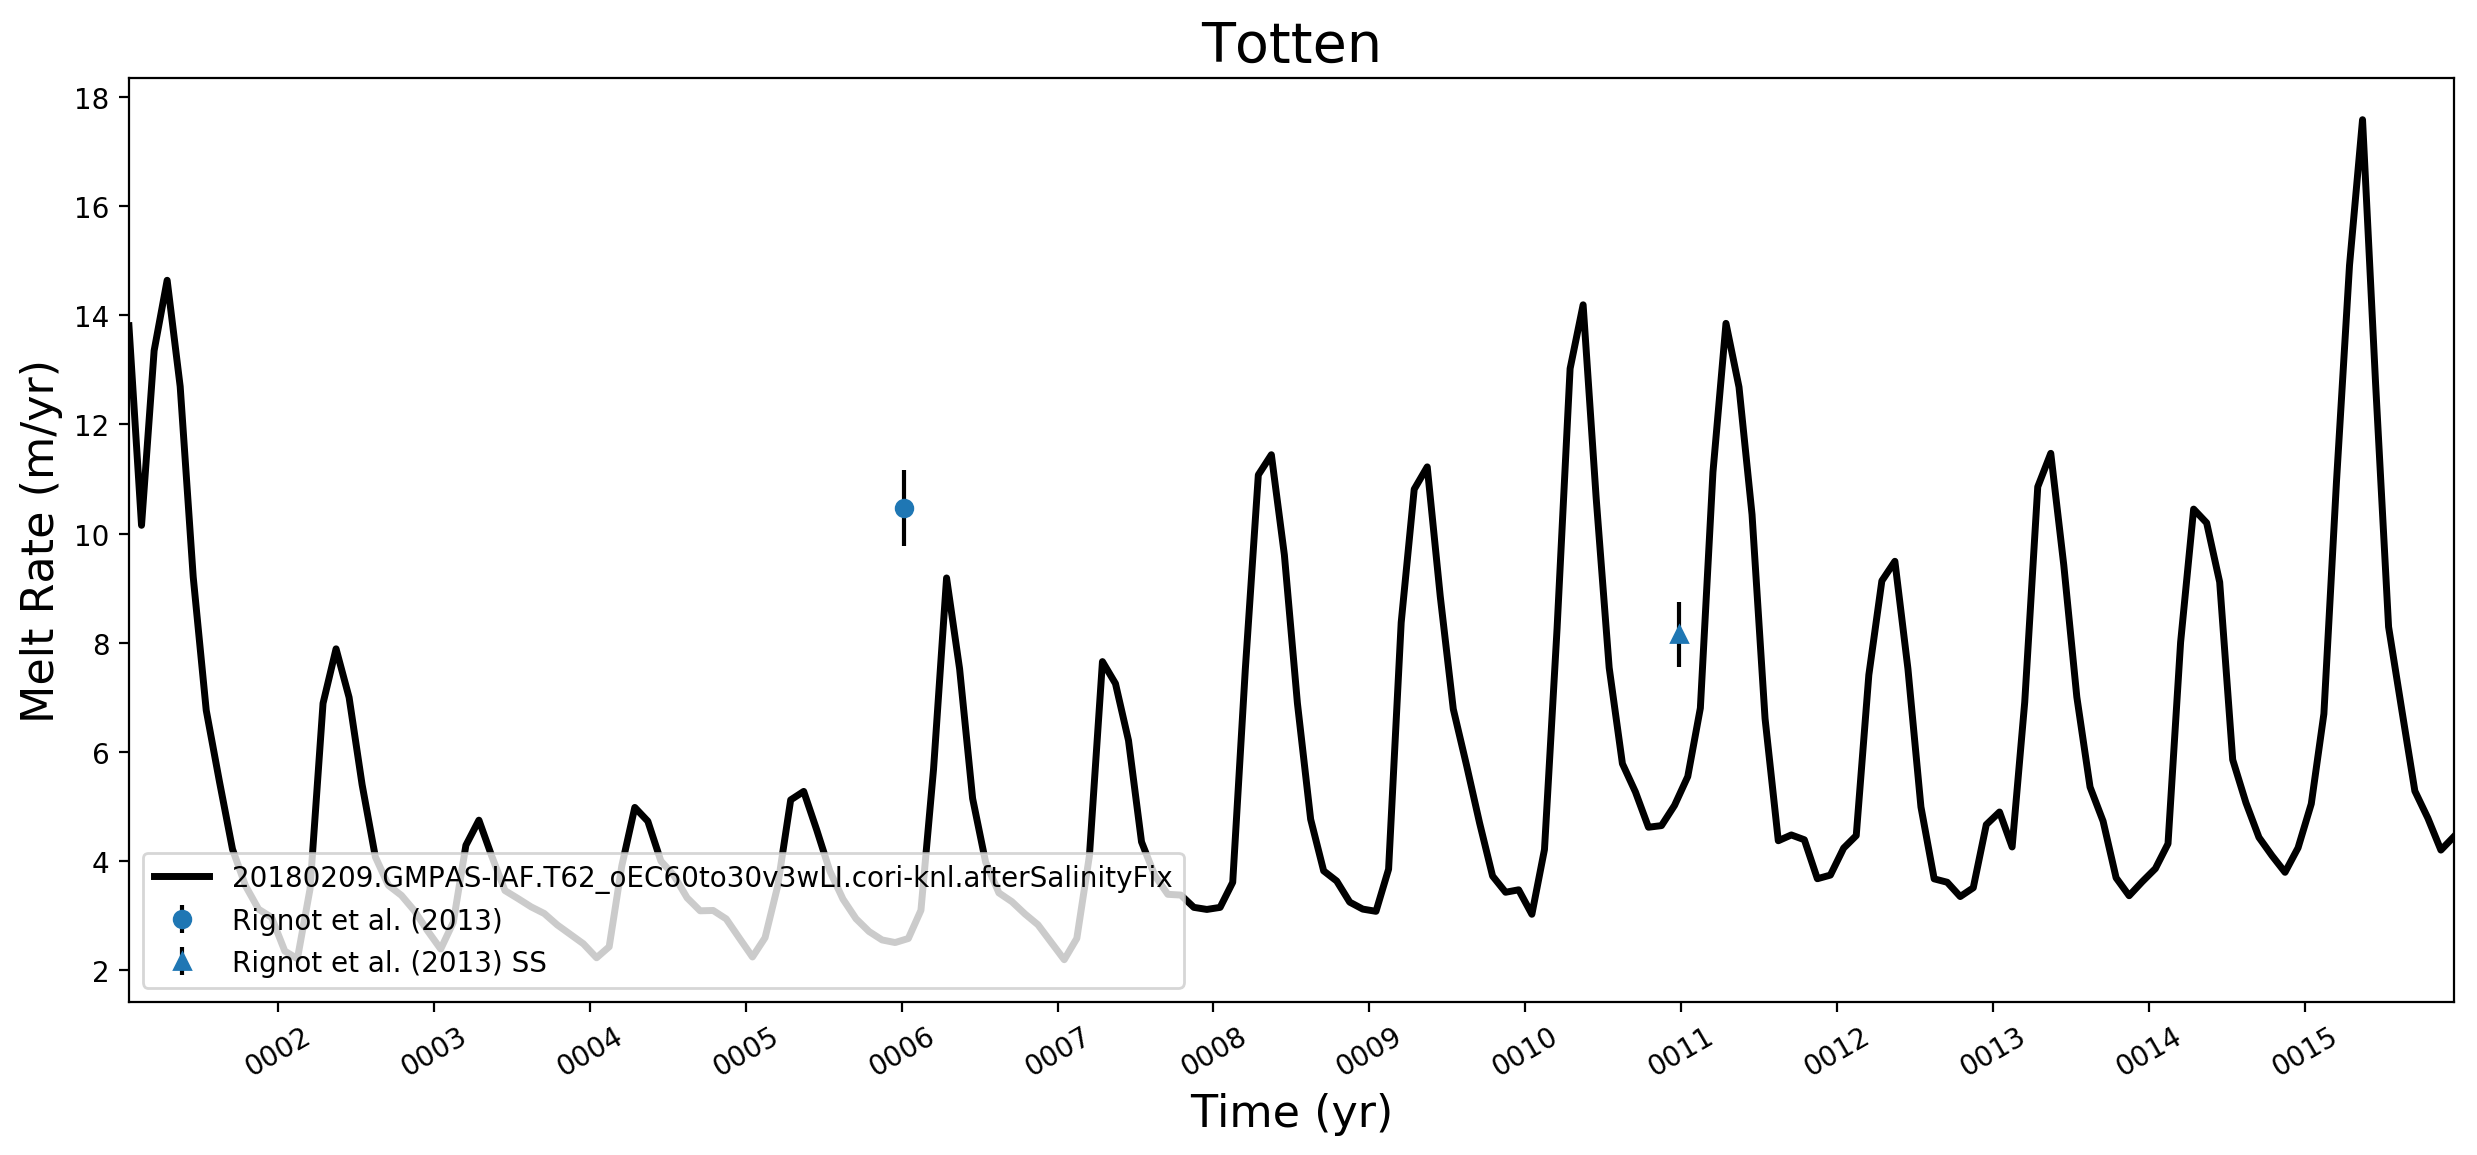
Totten
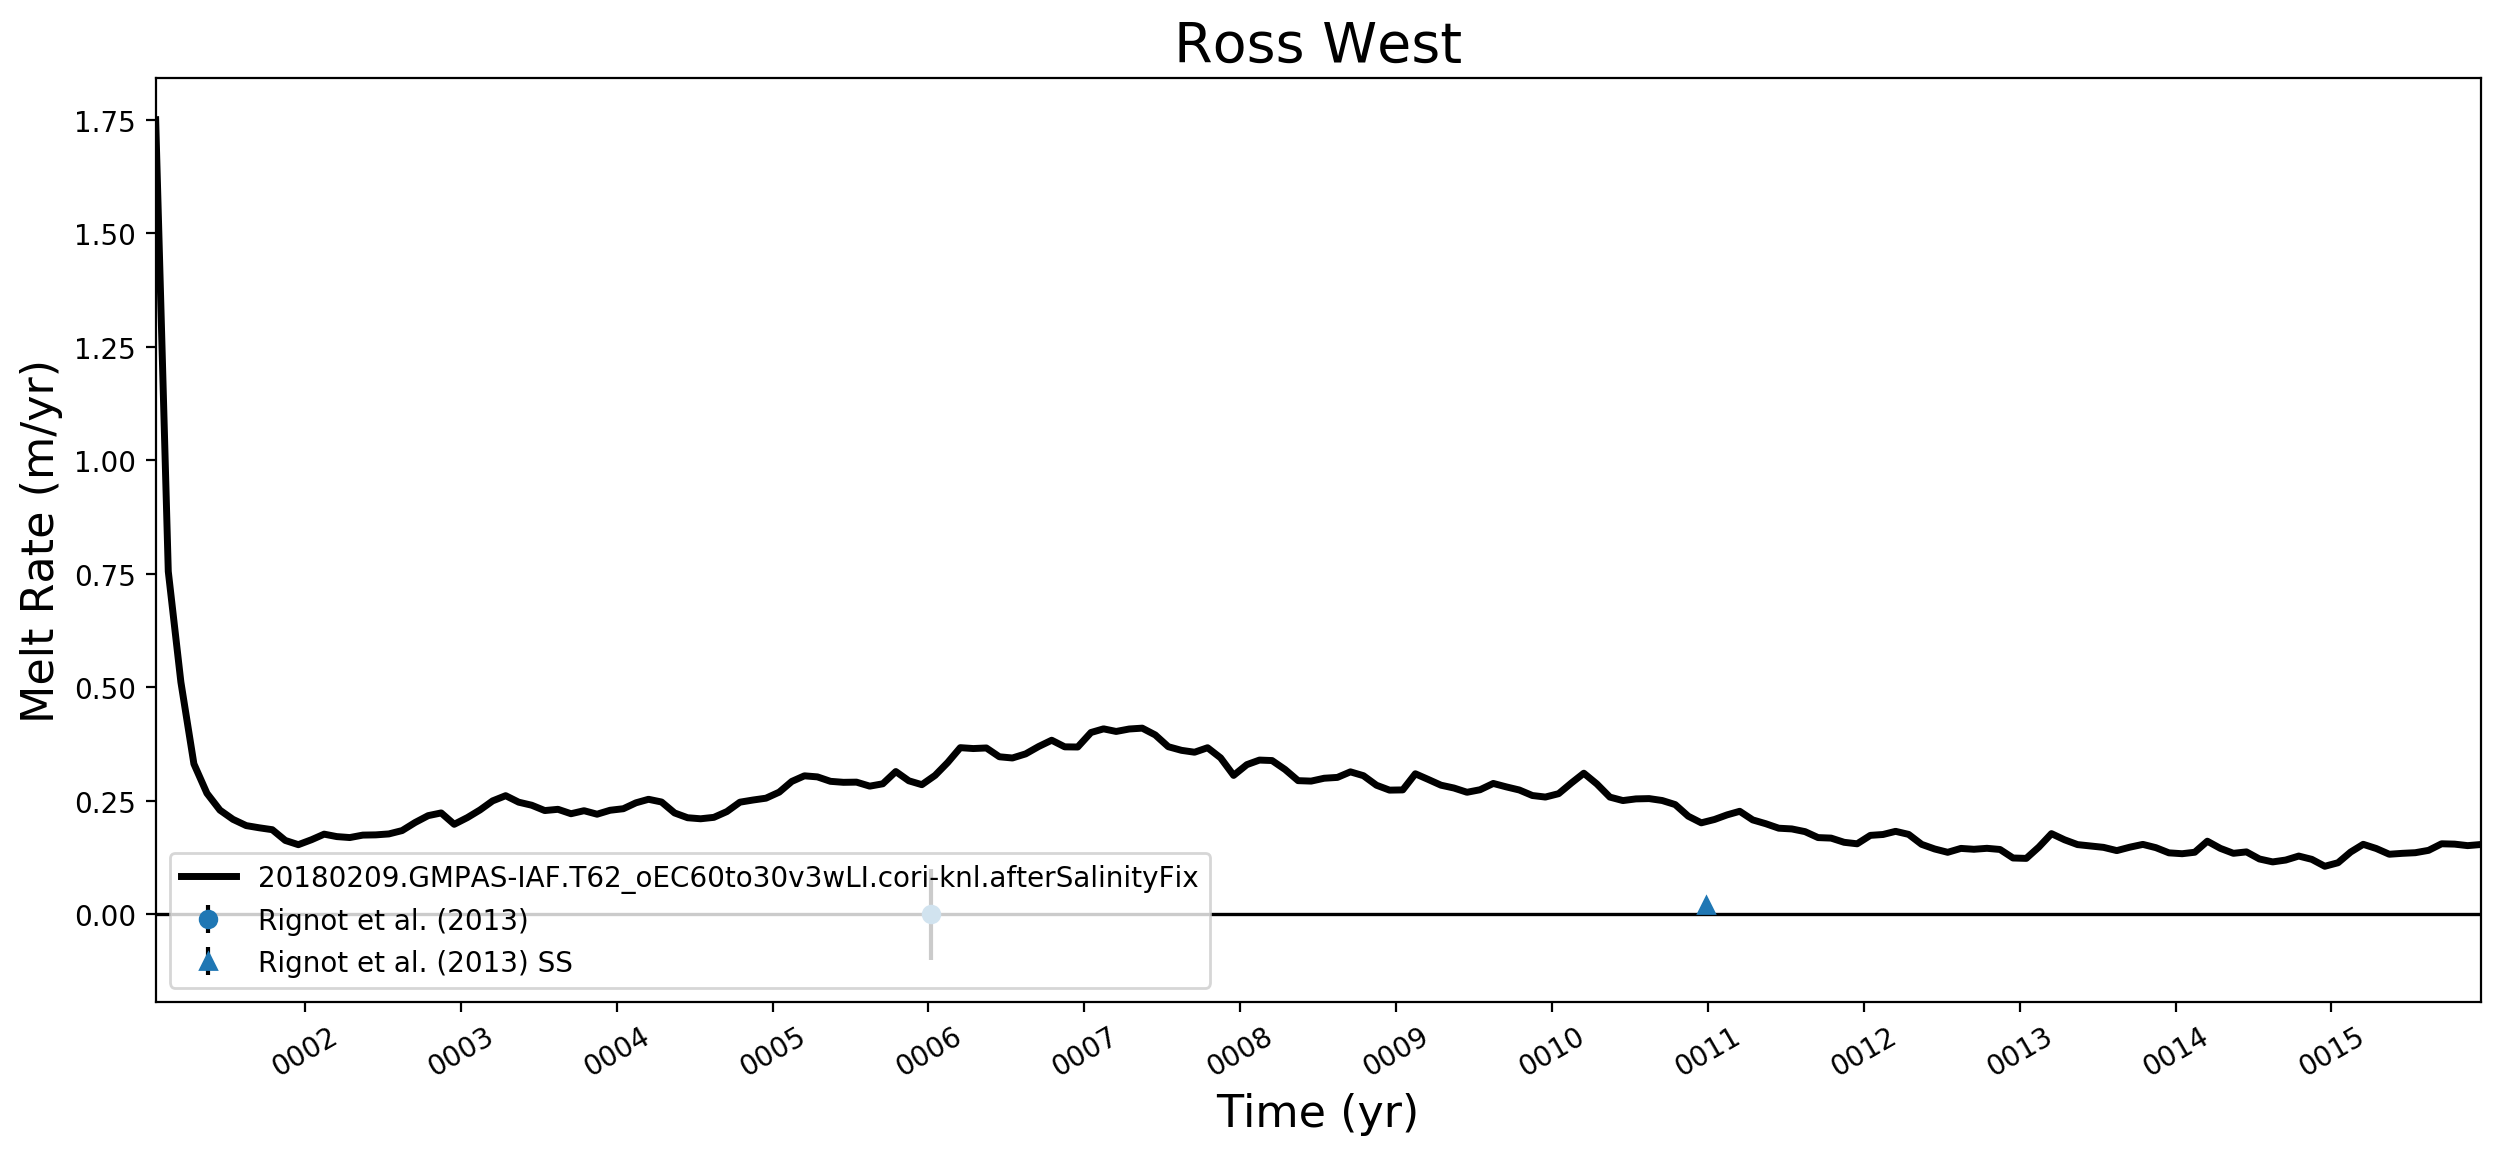
Ross West
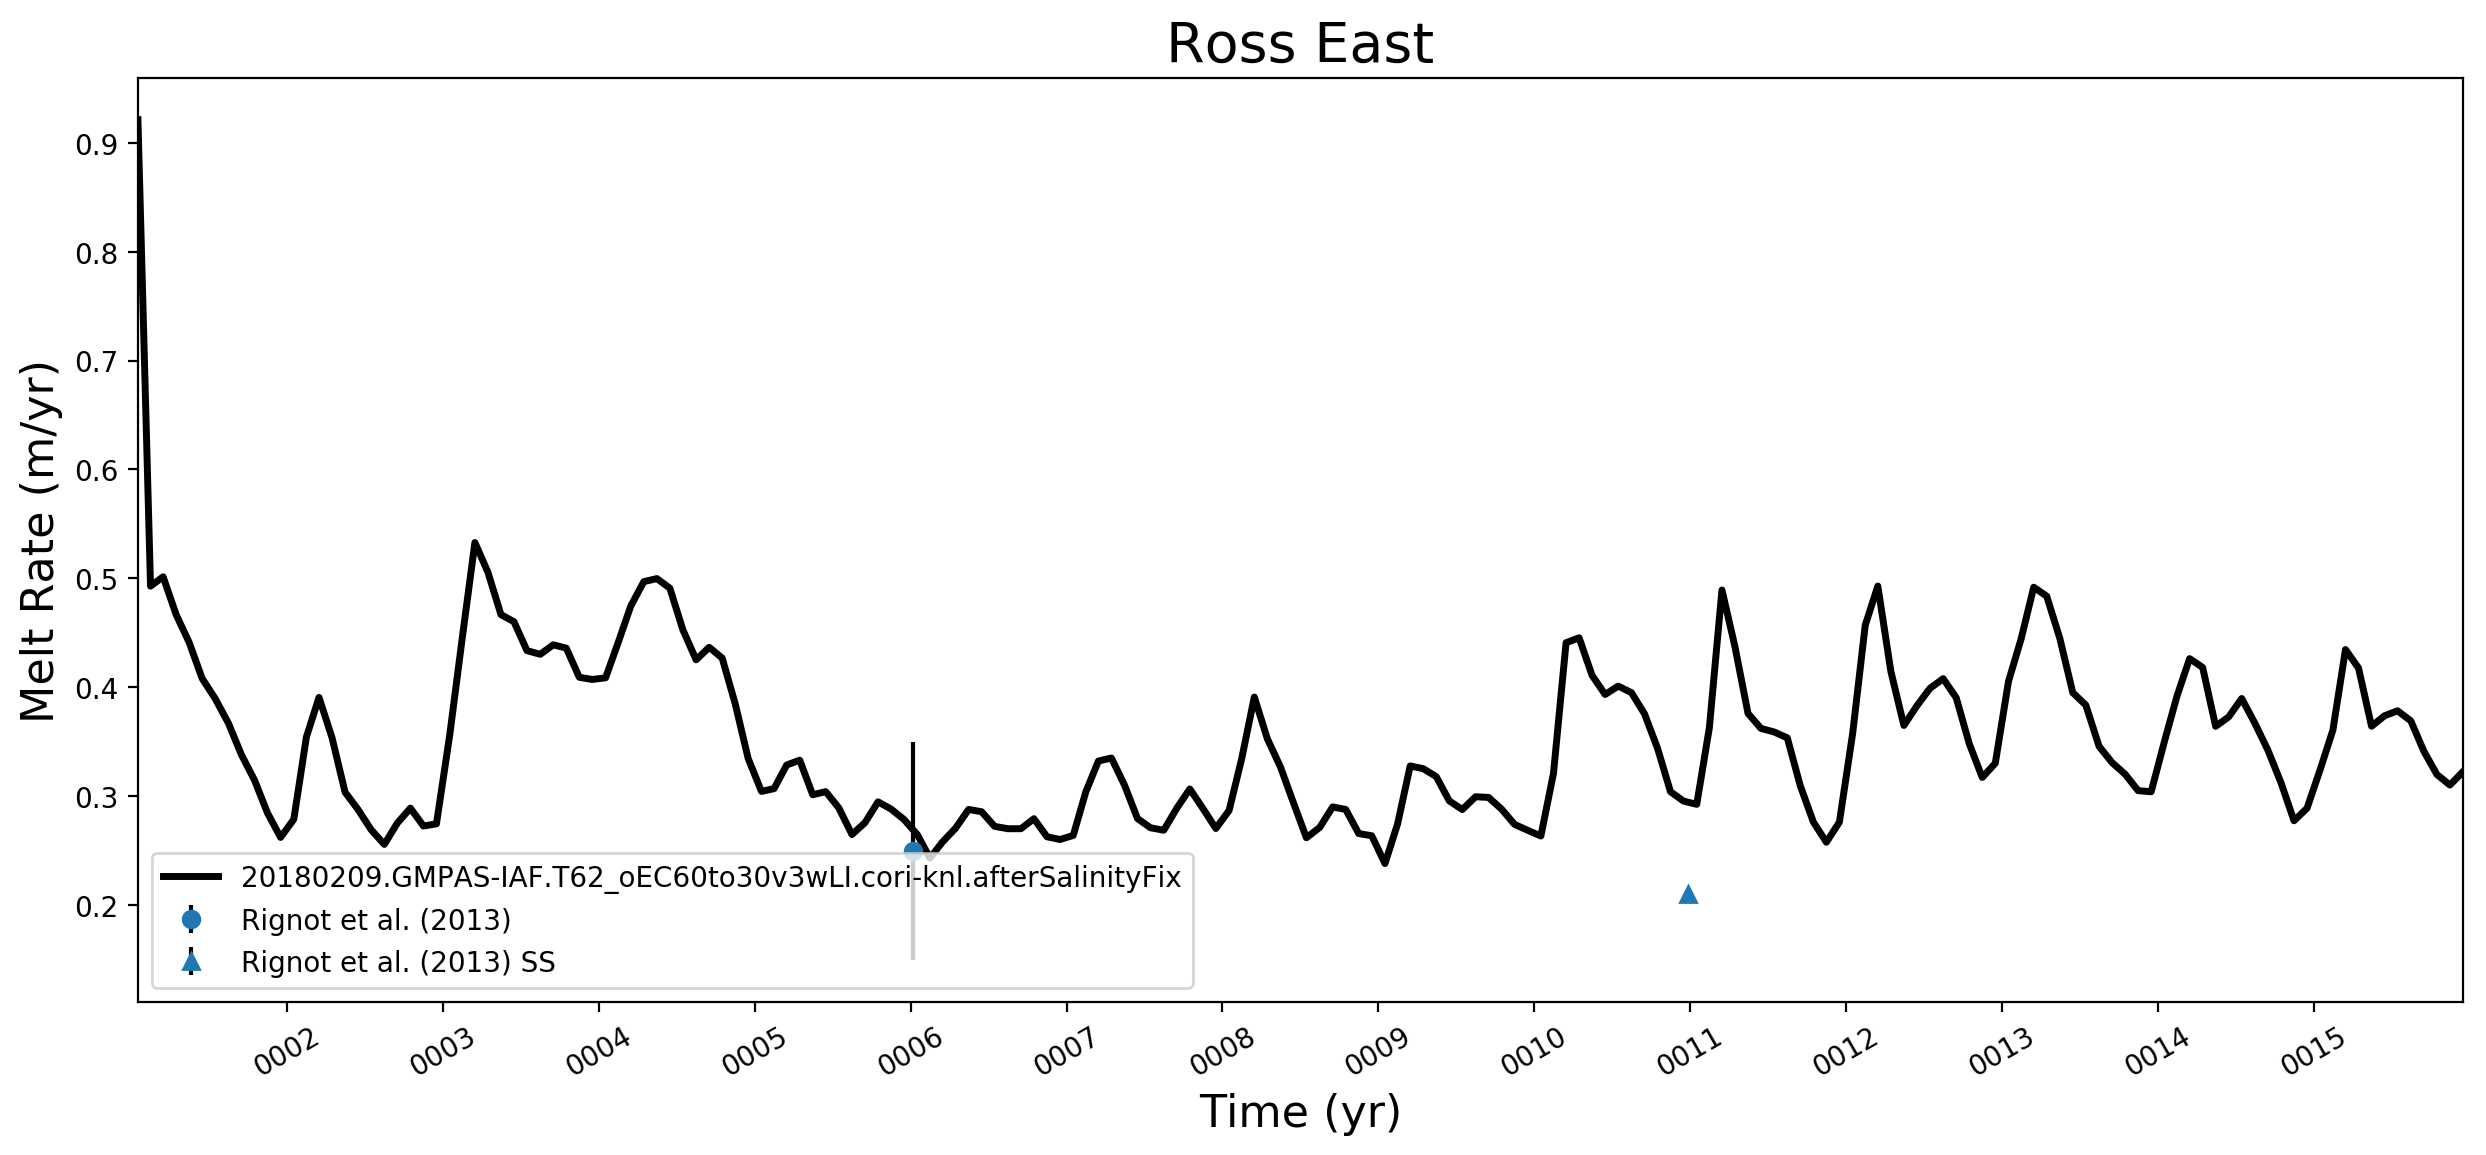
Ross East

Ross
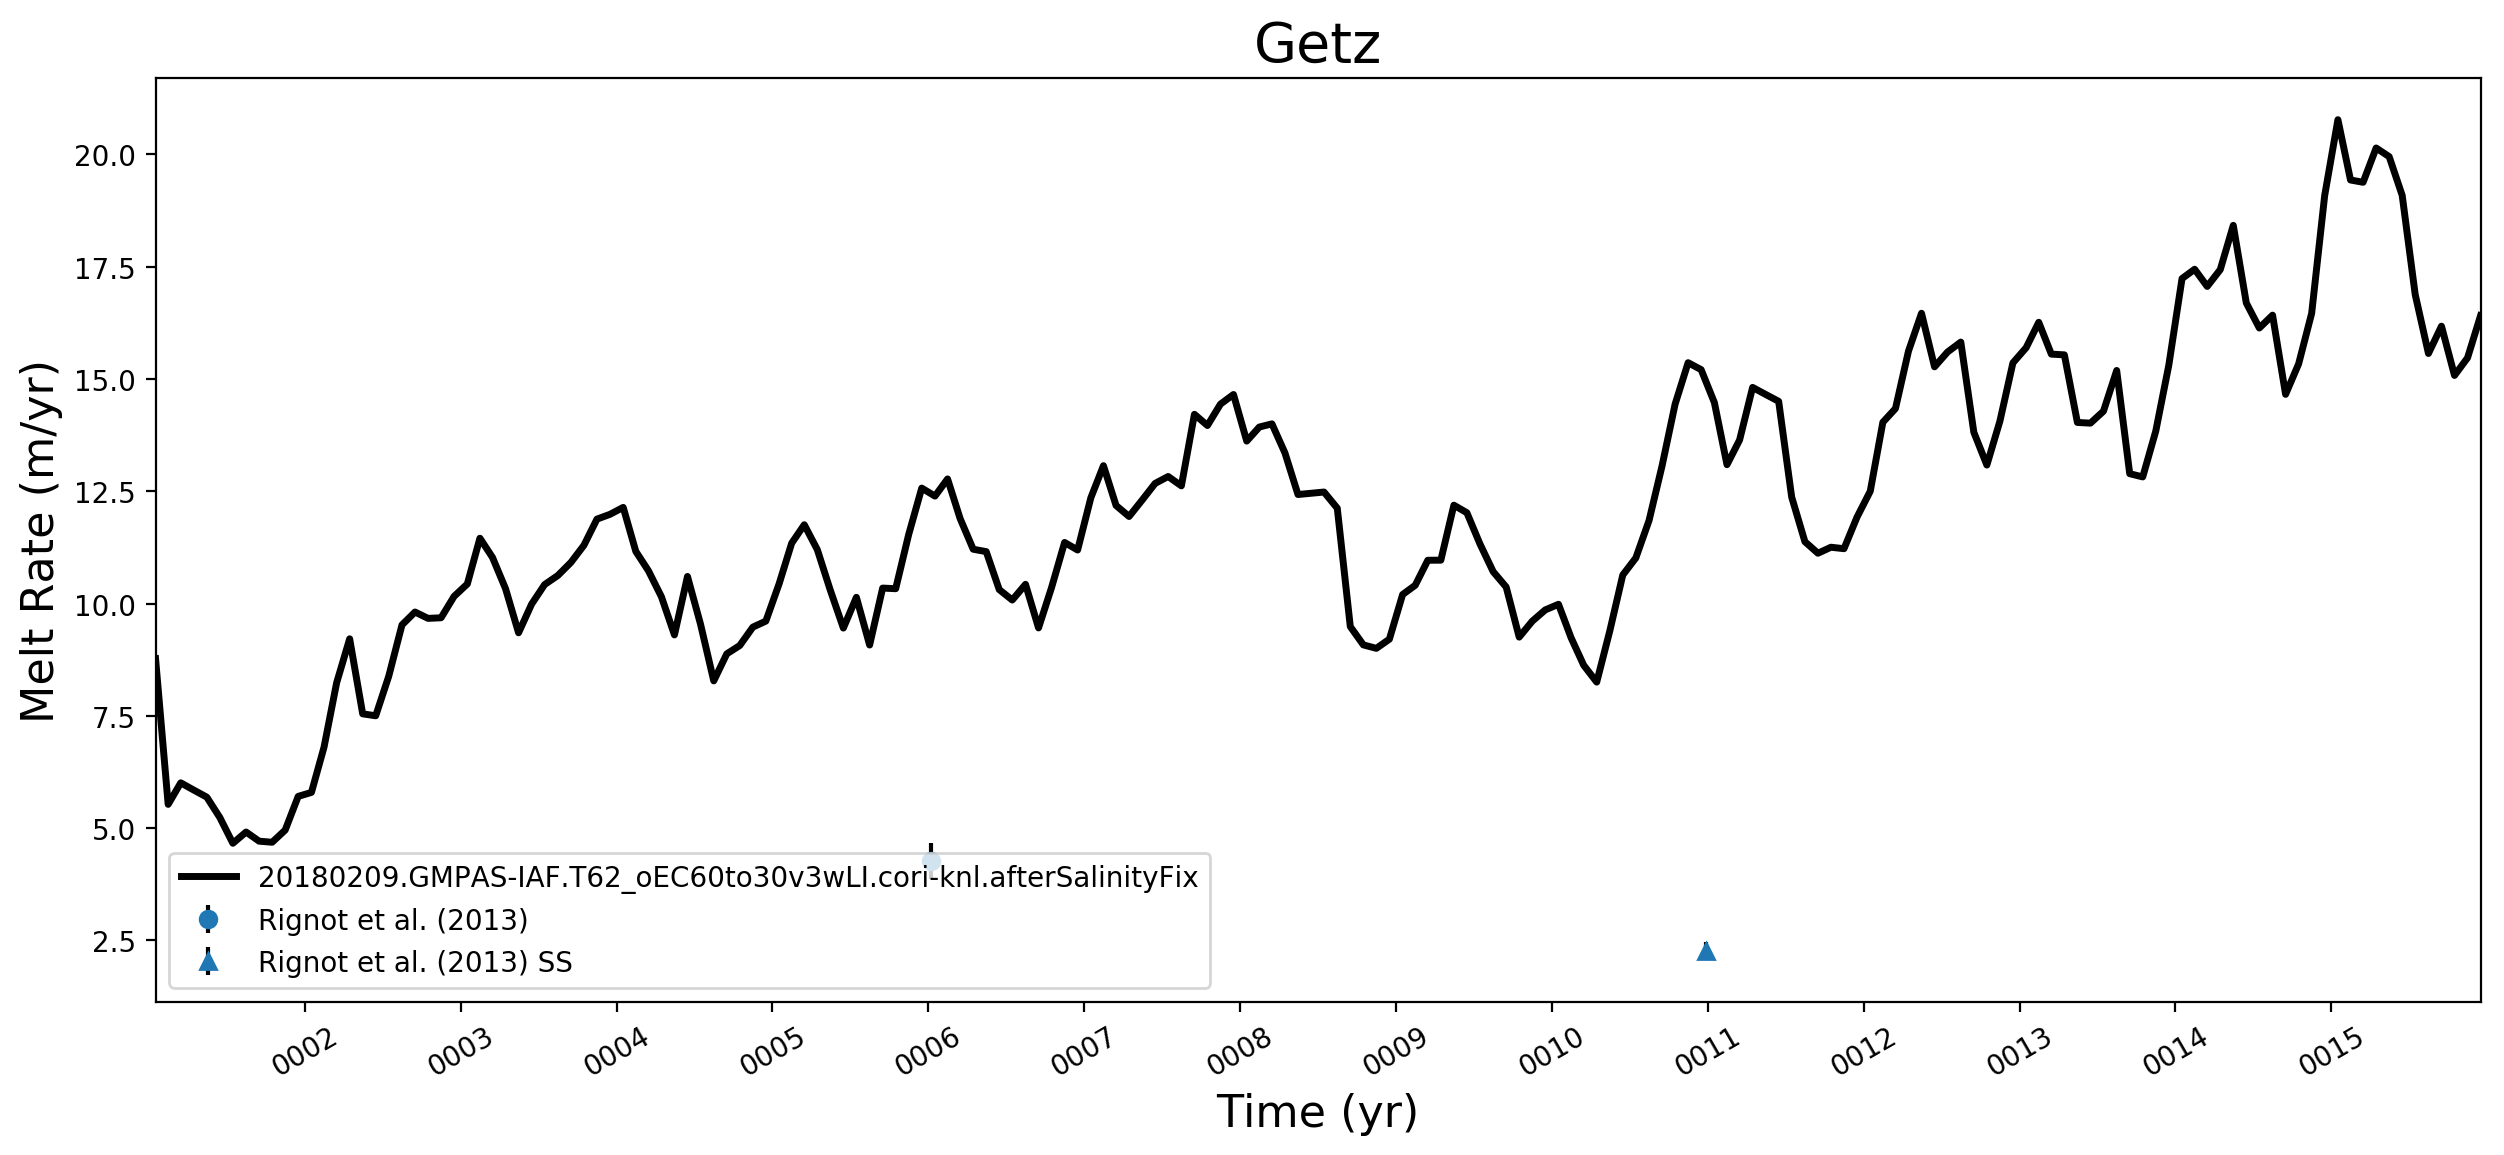
Getz
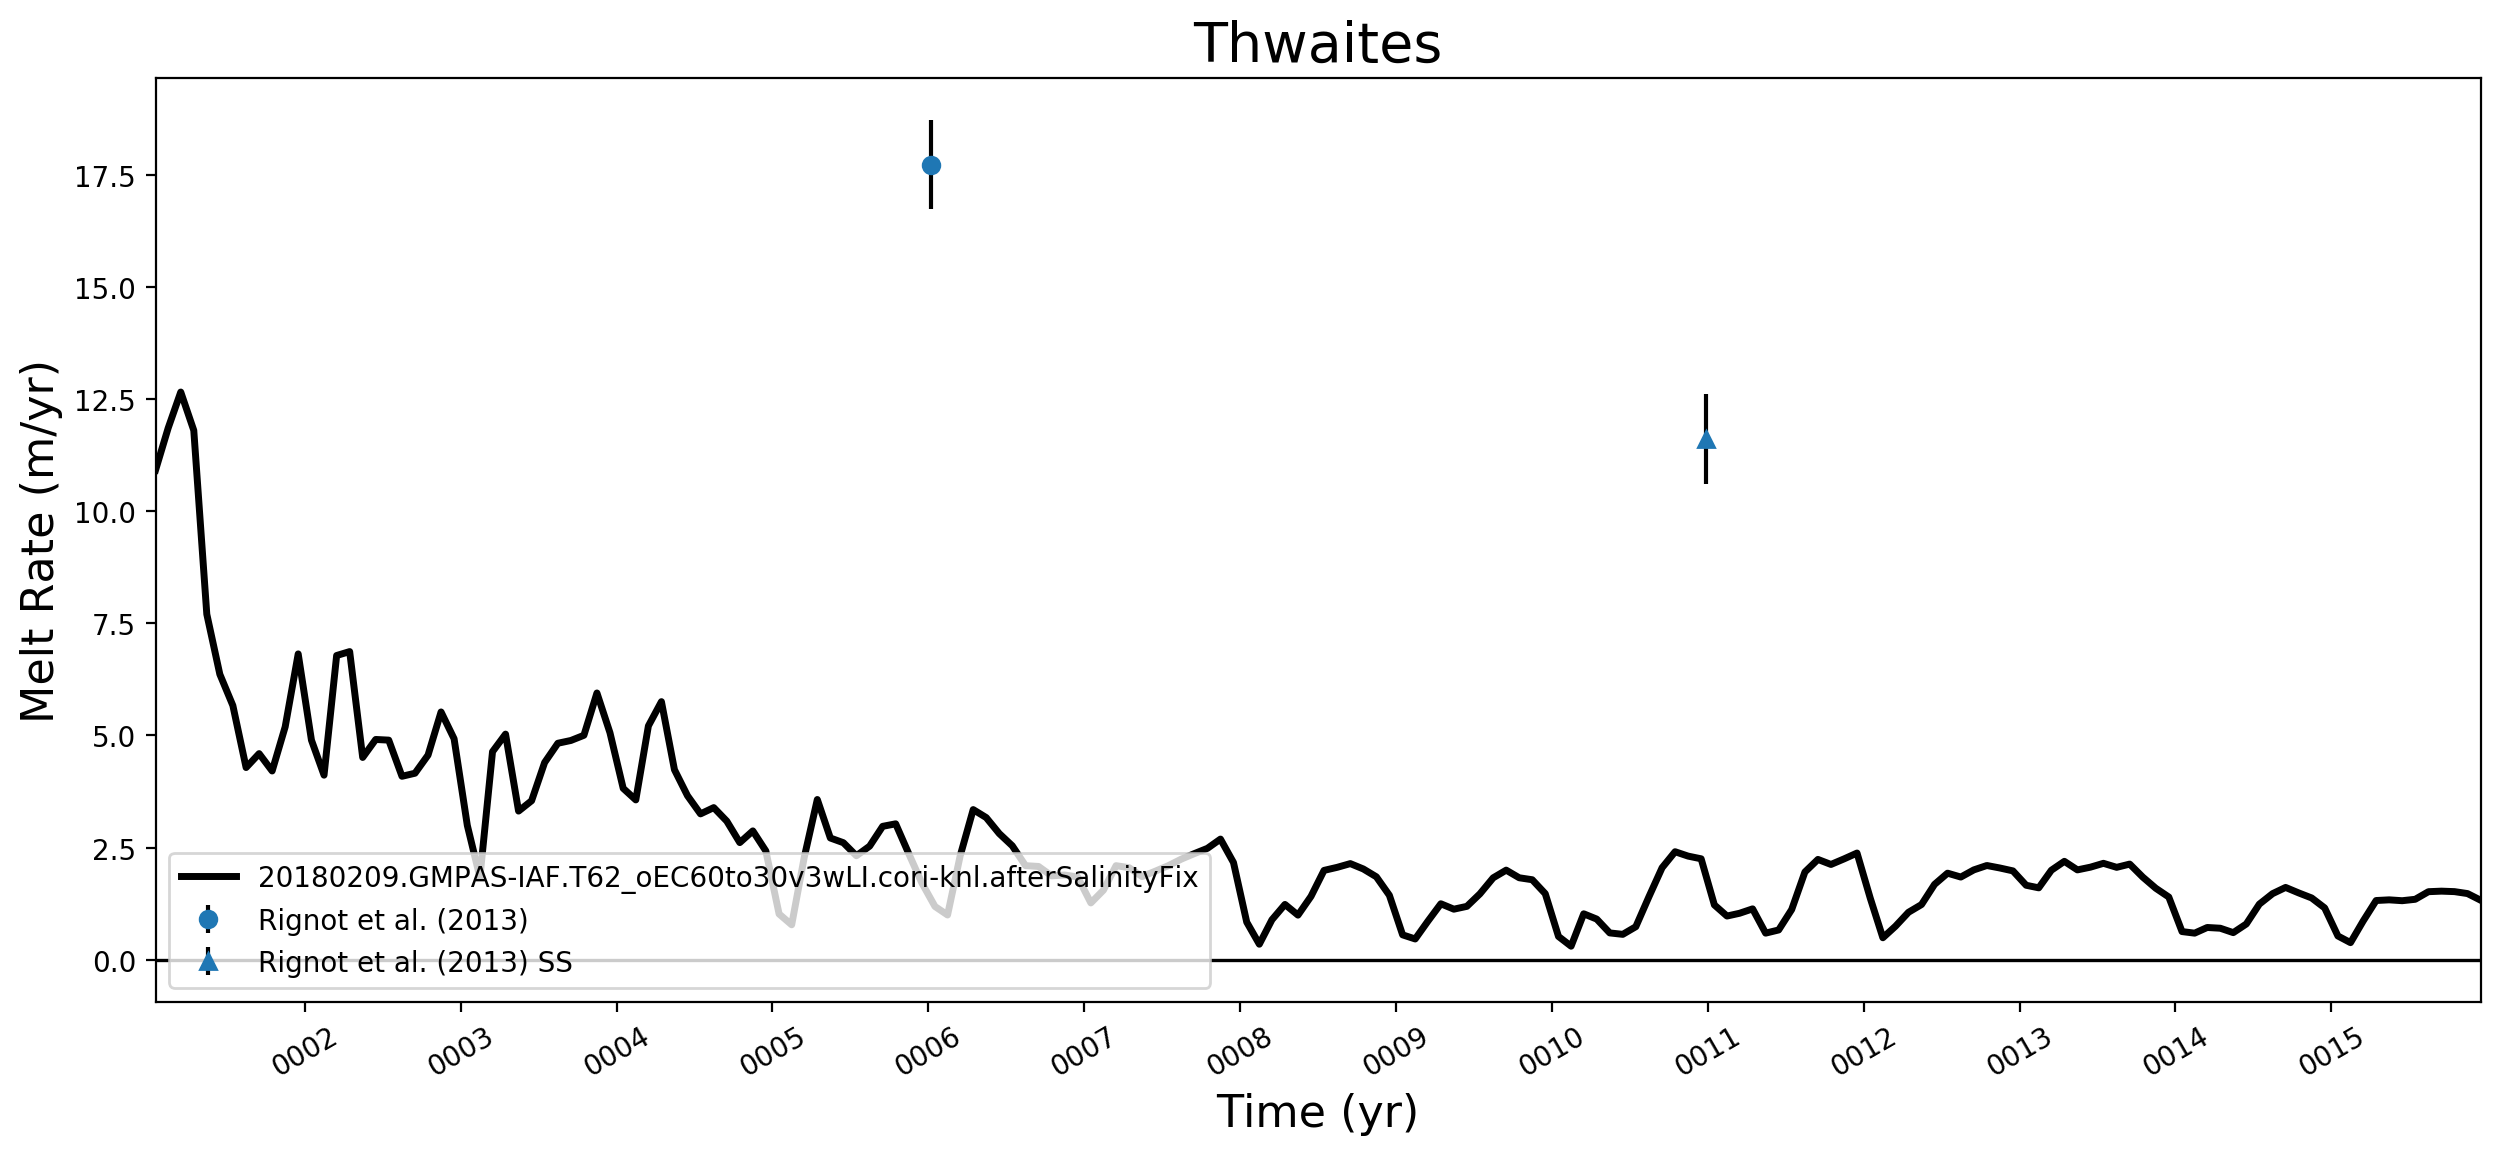
Thwaites
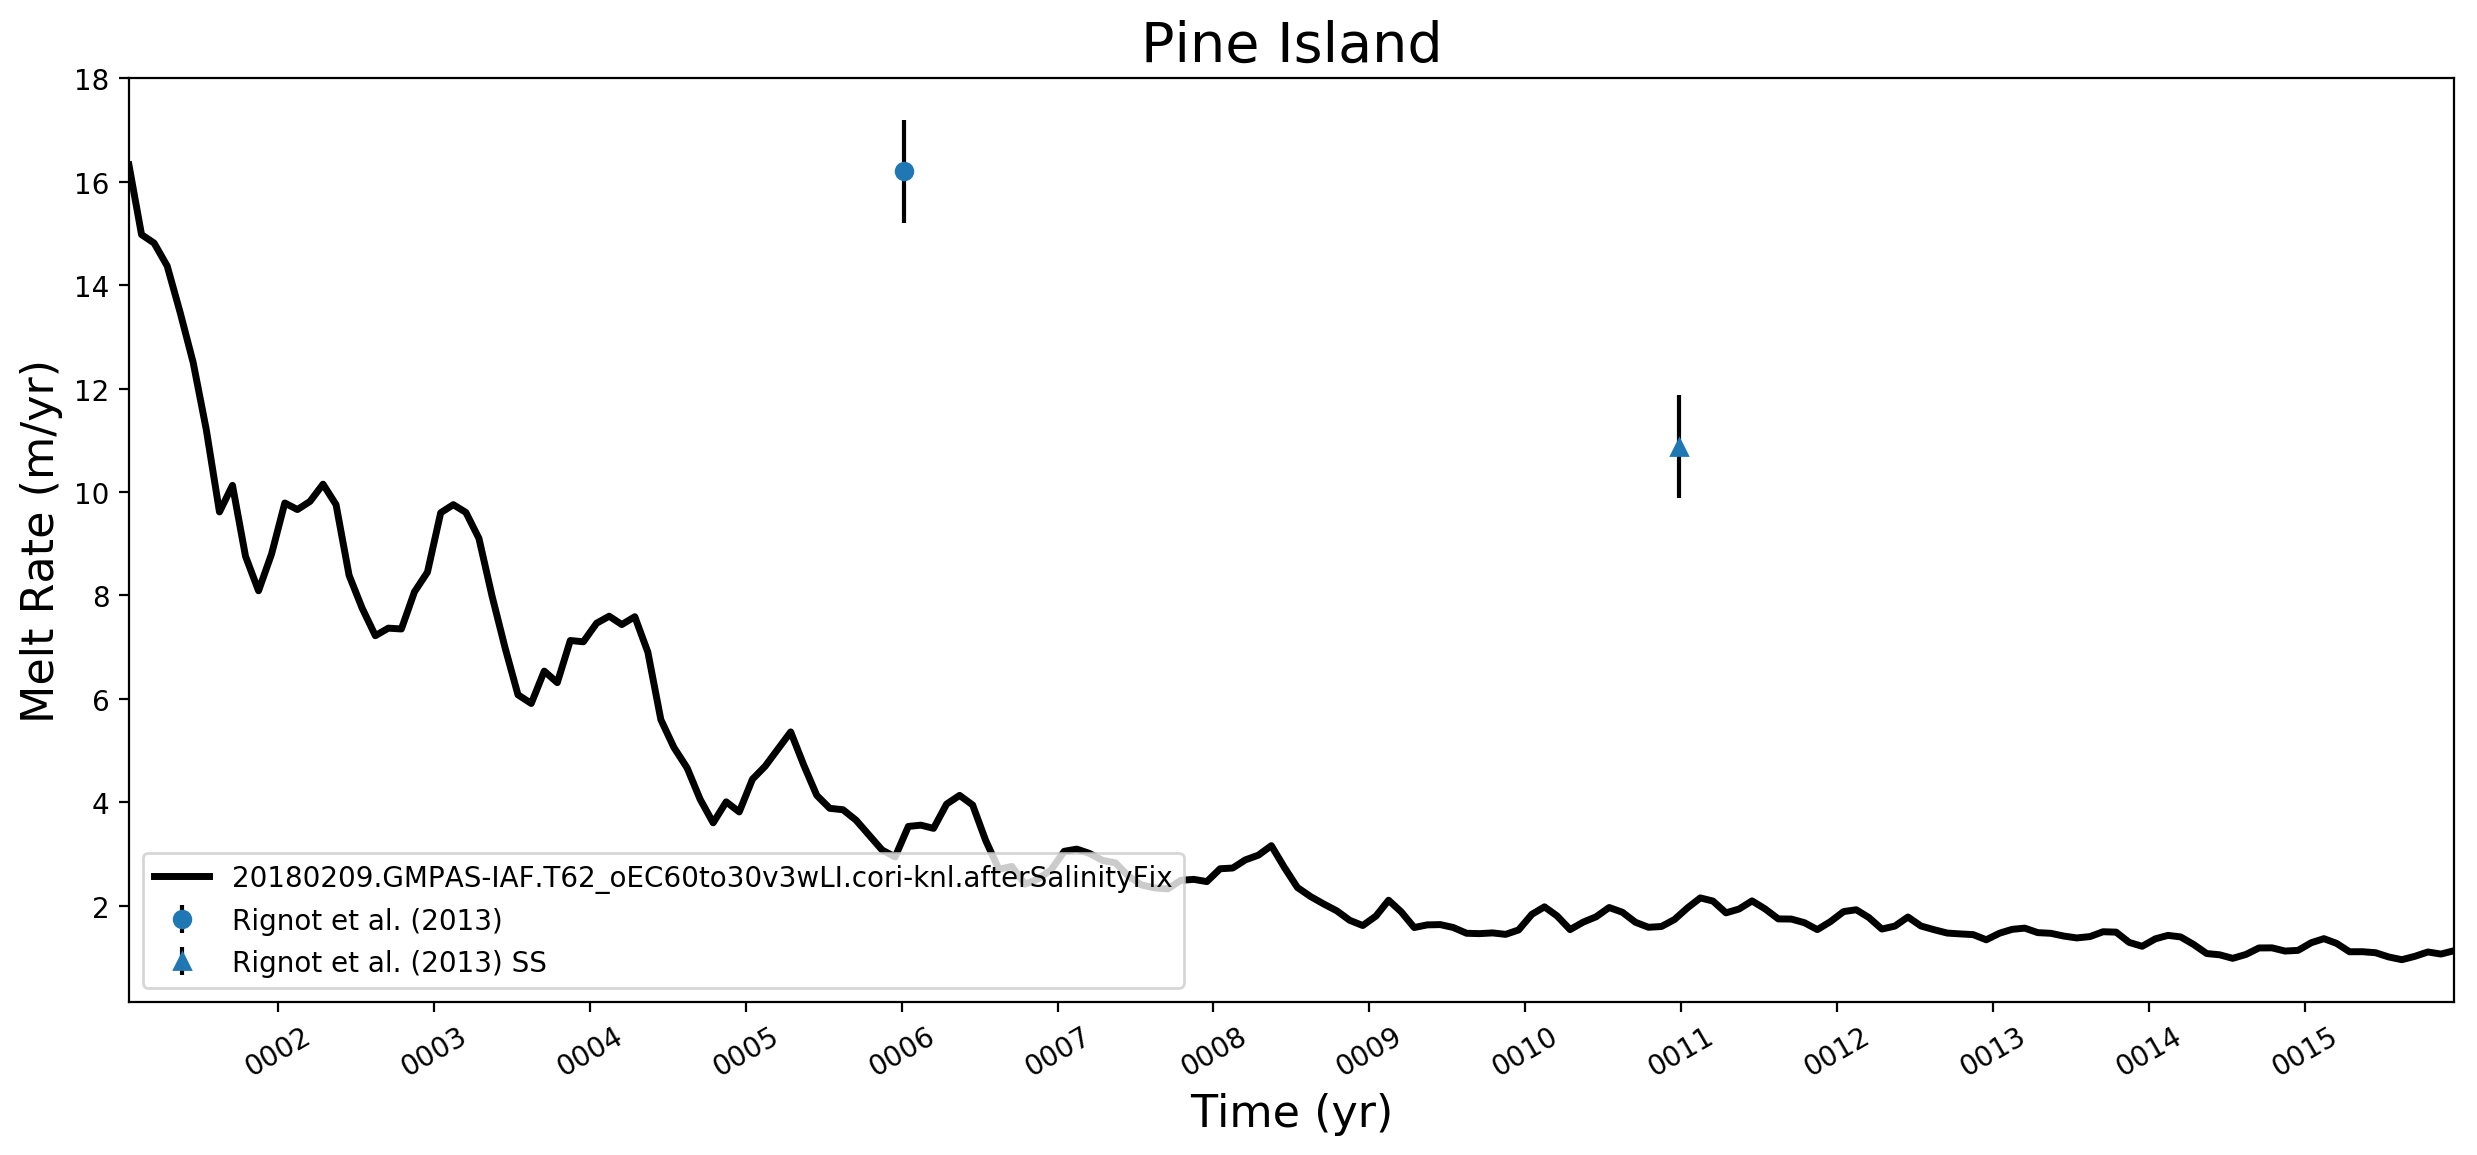
Pine Island
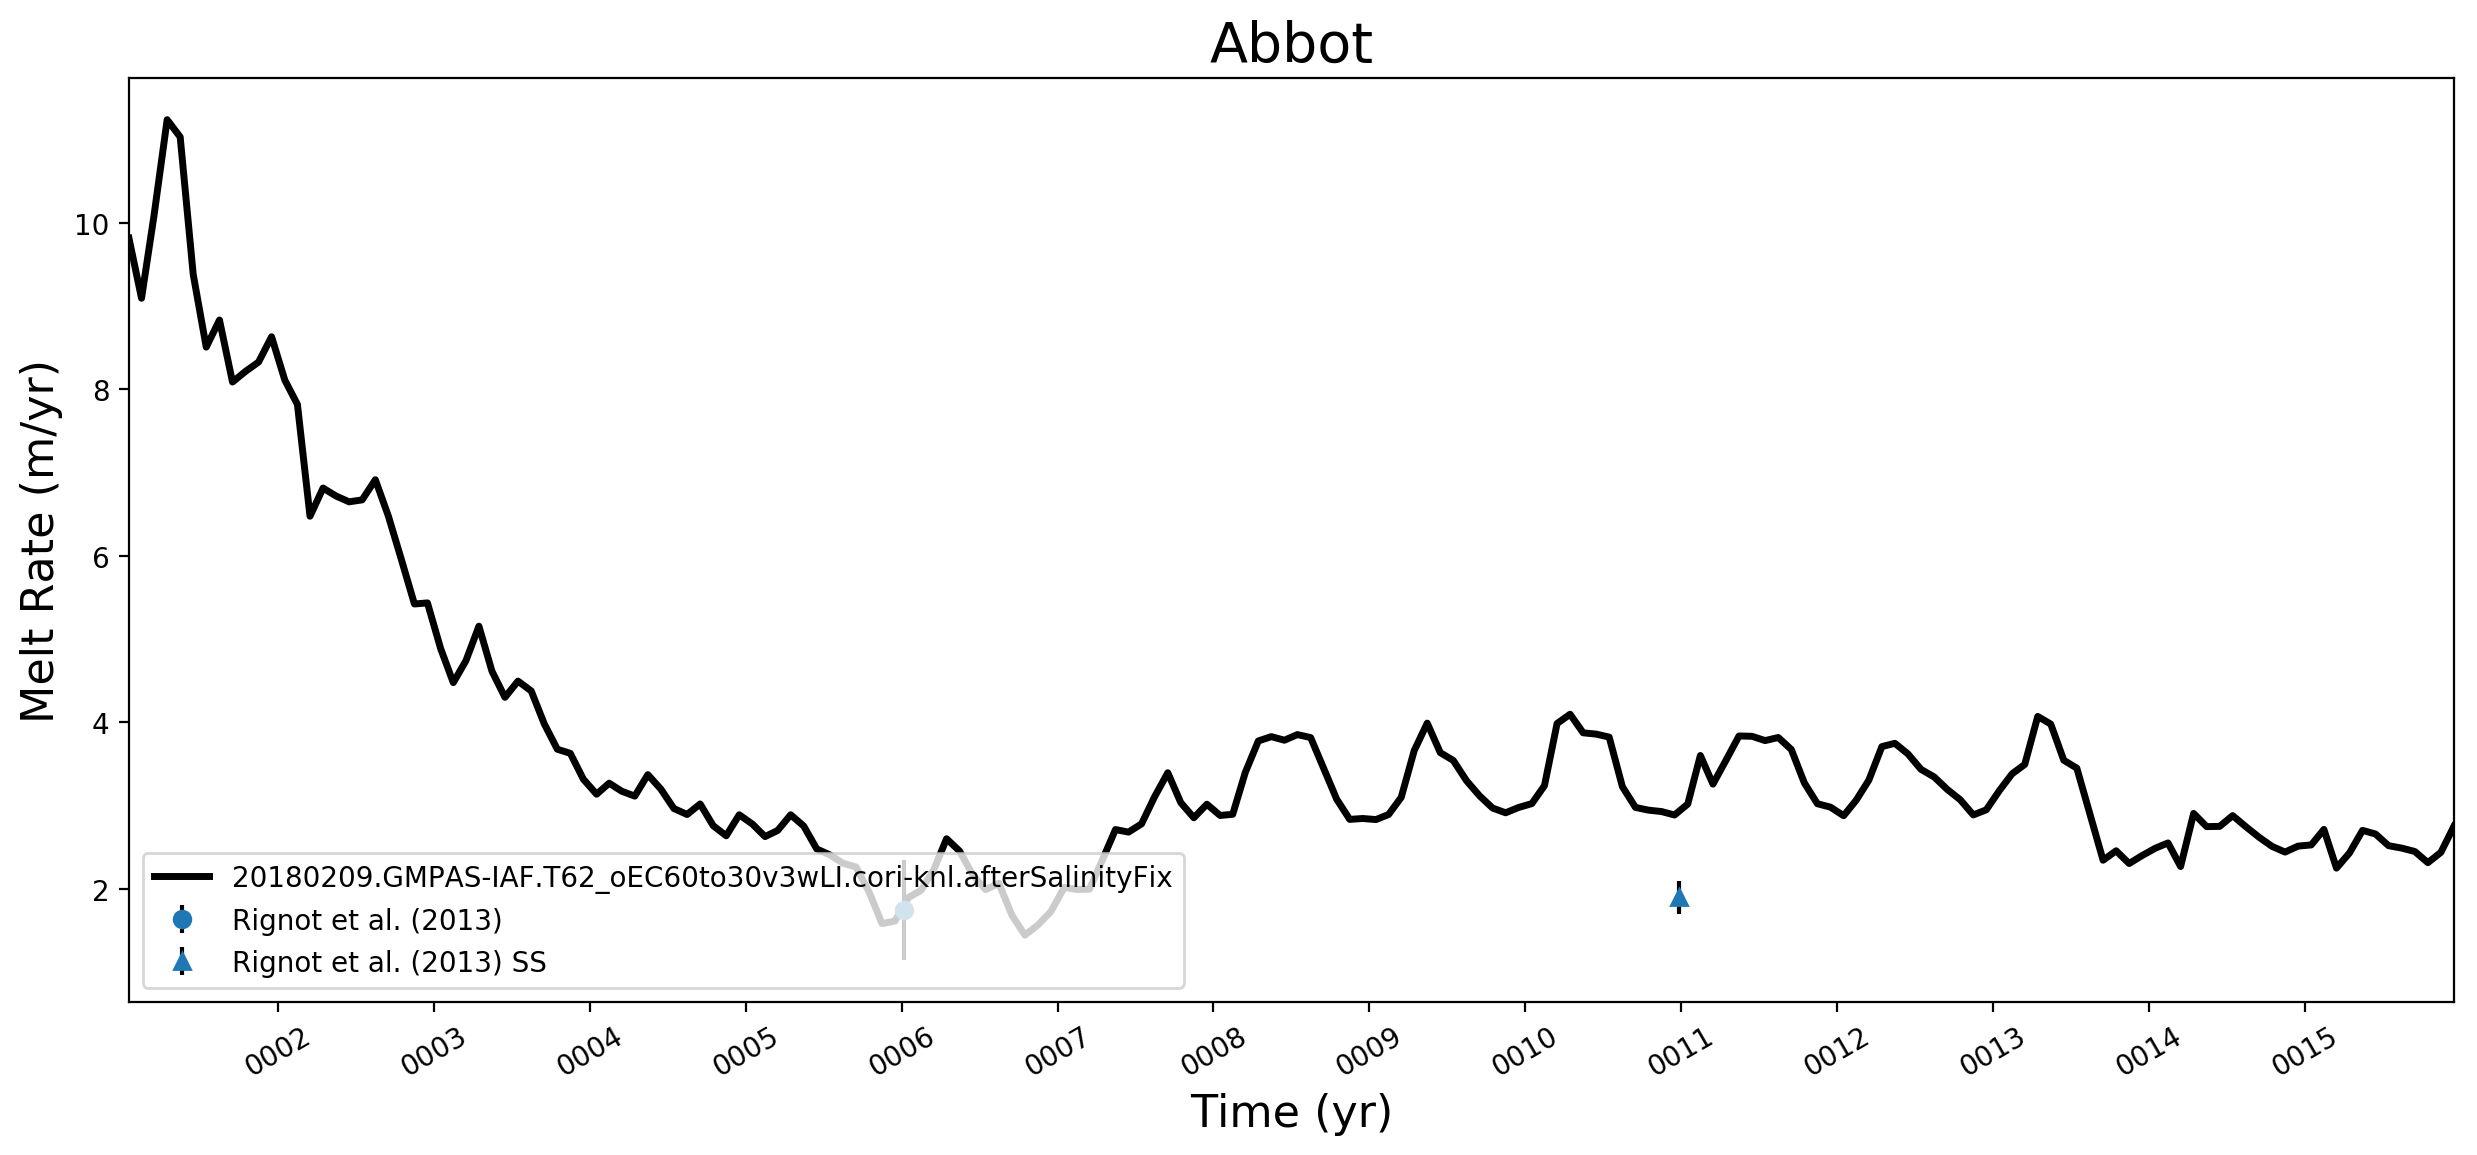
Abbot

George VI

global ΔT

global ΔS

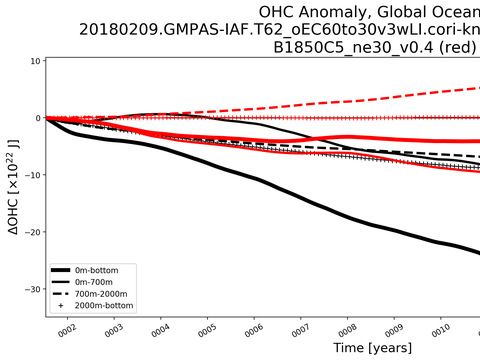
global ΔOHC

global ΔOHC

global SST


Global

Atlantic
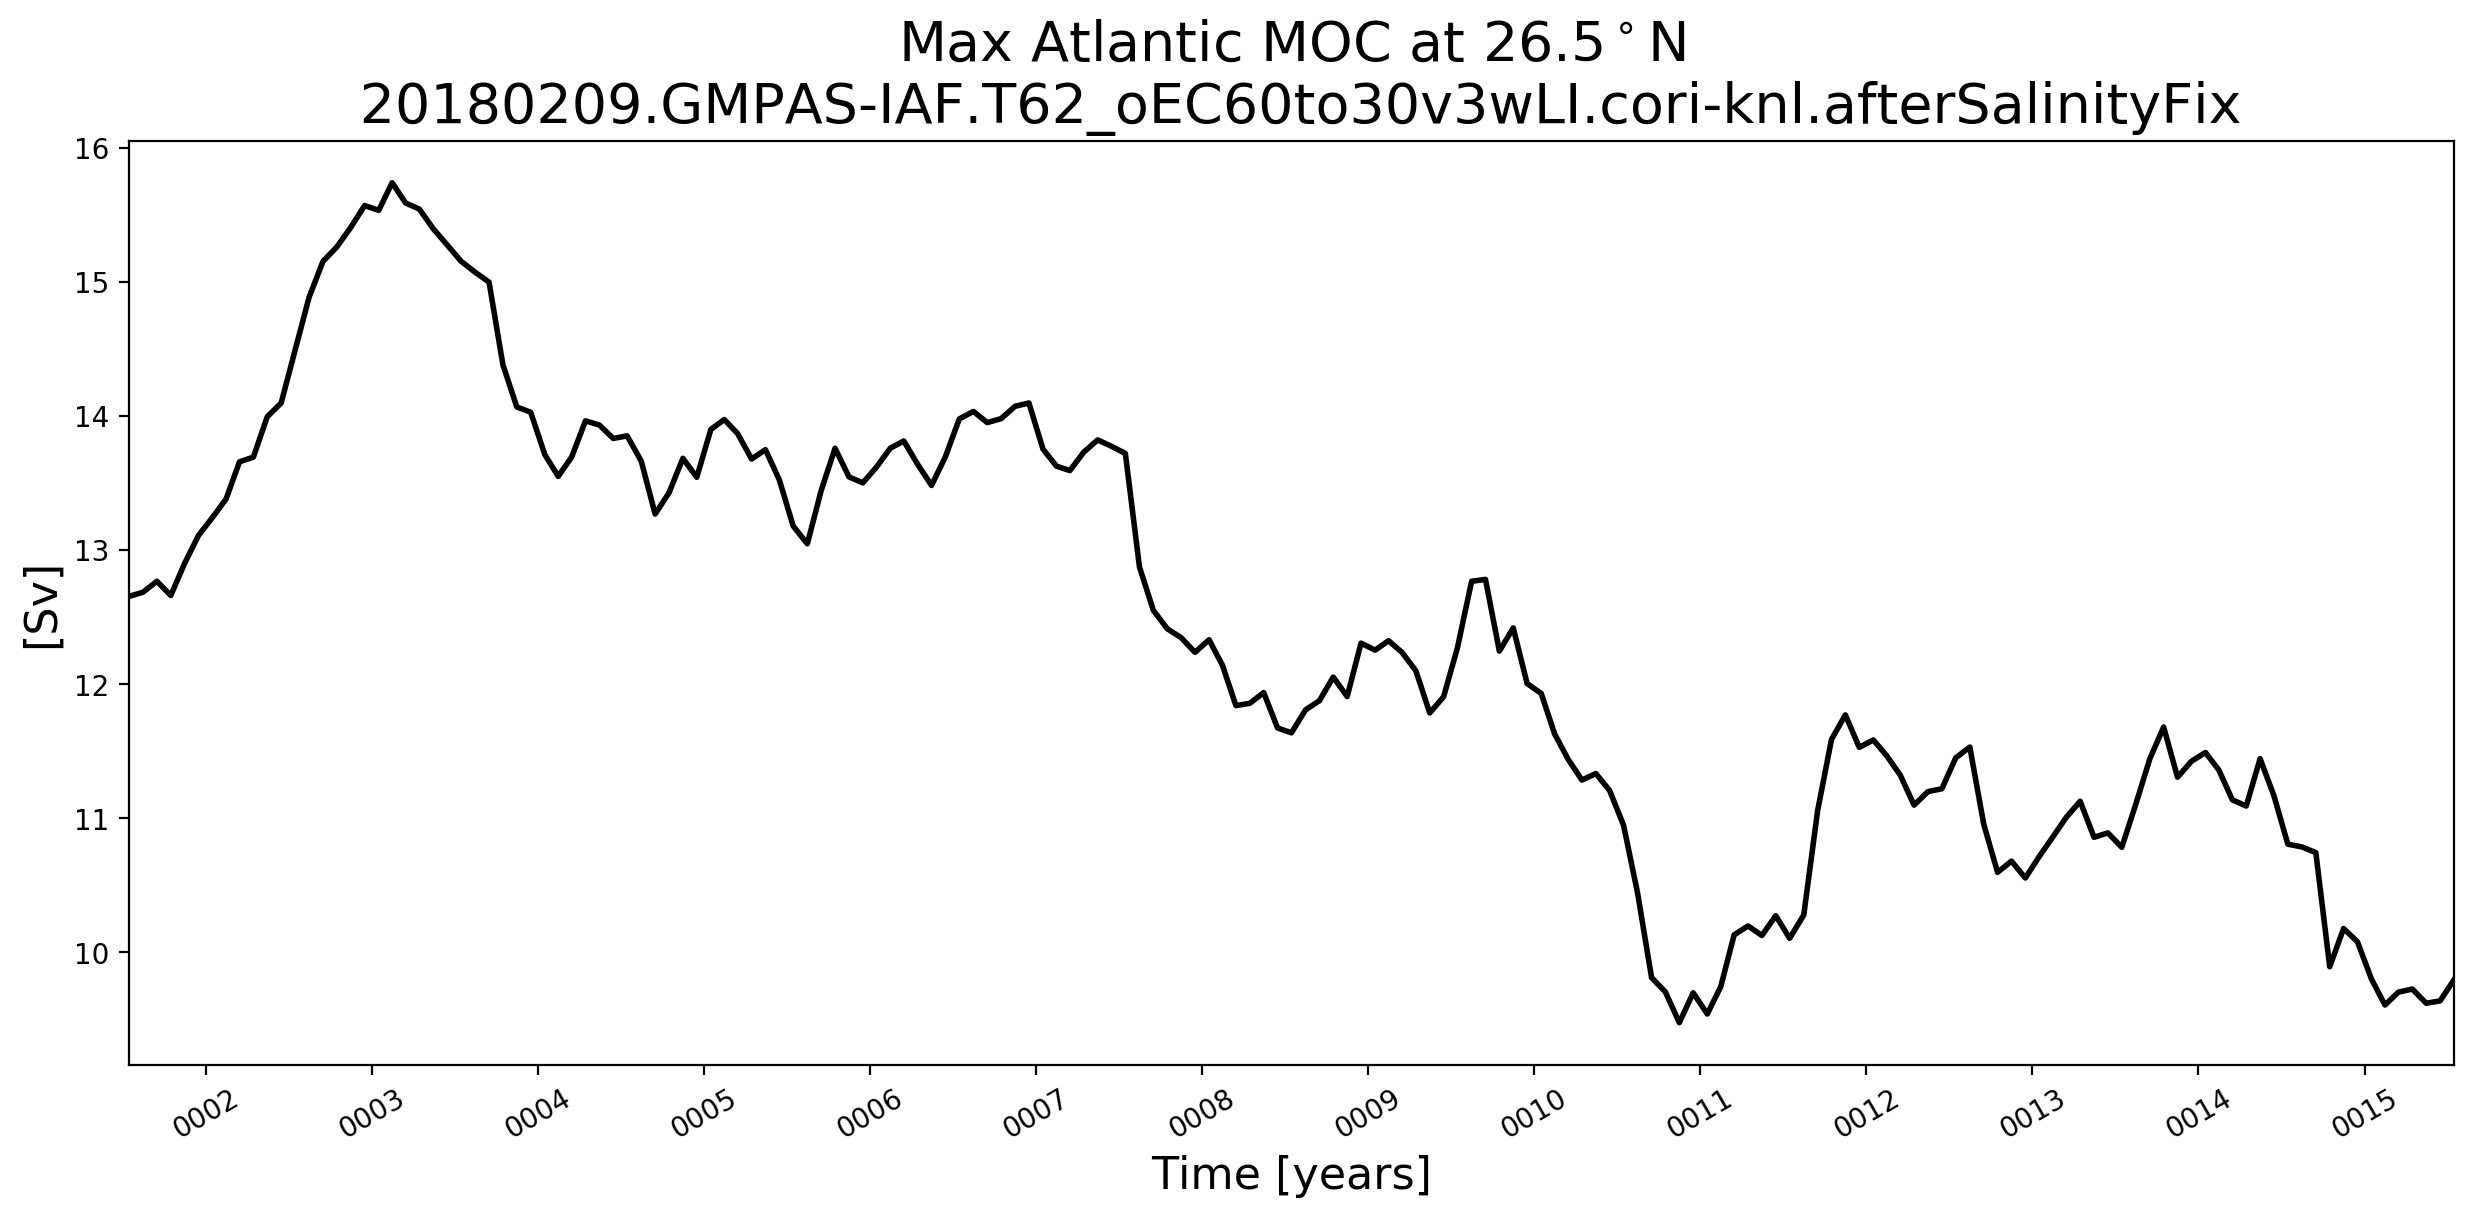
Time Series
Time Series

Spectra