climatologyMapSoseMLD
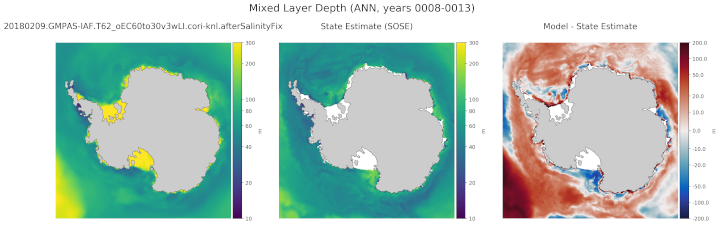
An analysis task for comparing mixed layer depth (MLD) against results from the Southern Ocean State Estimate (SOSE).
Component and Tags:
component: ocean
tags: climatology, horizontalMap, sose, mld
Configuration Options
The following configuration options are available for this task:
[climatologyMapSoseMLD]
## options related to plotting climatology maps of Antarctic
## mixed layer depth against reference model results and SOSE reanalysis data

# comparison grid(s)
# only the Antarctic really makes sense but lat-lon could technically work.
comparisonGrids = ['antarctic']

# Months or seasons to plot (Jan, Feb, Mar, Apr, May, Jun, Jul, Aug, Sep,
# Oct, Nov, Dec, JFM, AMJ, JAS, OND, ANN)
seasons =  ['ANN','JFM','JAS']

# colormap for model/observations
colormapNameResult = viridis
# color indices into colormapName for filled contours
# the type of norm used in the colormap
normTypeResult = log
# A dictionary with keywords for the SemiLogNorm
normArgsResult = {'vmin': 10., 'vmax': 300.}
# specify the ticks
colorbarTicksResult = [10, 20, 40, 60, 80, 100, 200, 300]

# colormap for differences
colormapNameDifference = balance
# the type of norm used in the colormap
normTypeDifference = symLog
# A dictionary with keywords for the SemiLogNorm
normArgsDifference = {'linthresh': 10., 'linscale': 0.5, 'vmin': -200.,
                      'vmax': 200.}
colorbarTicksDifference = [-200., -100., -50., -20., -10., 0., 10., 20., 50.,
                           100., 200.]
- For more details, see:
State Estimate
Example Result