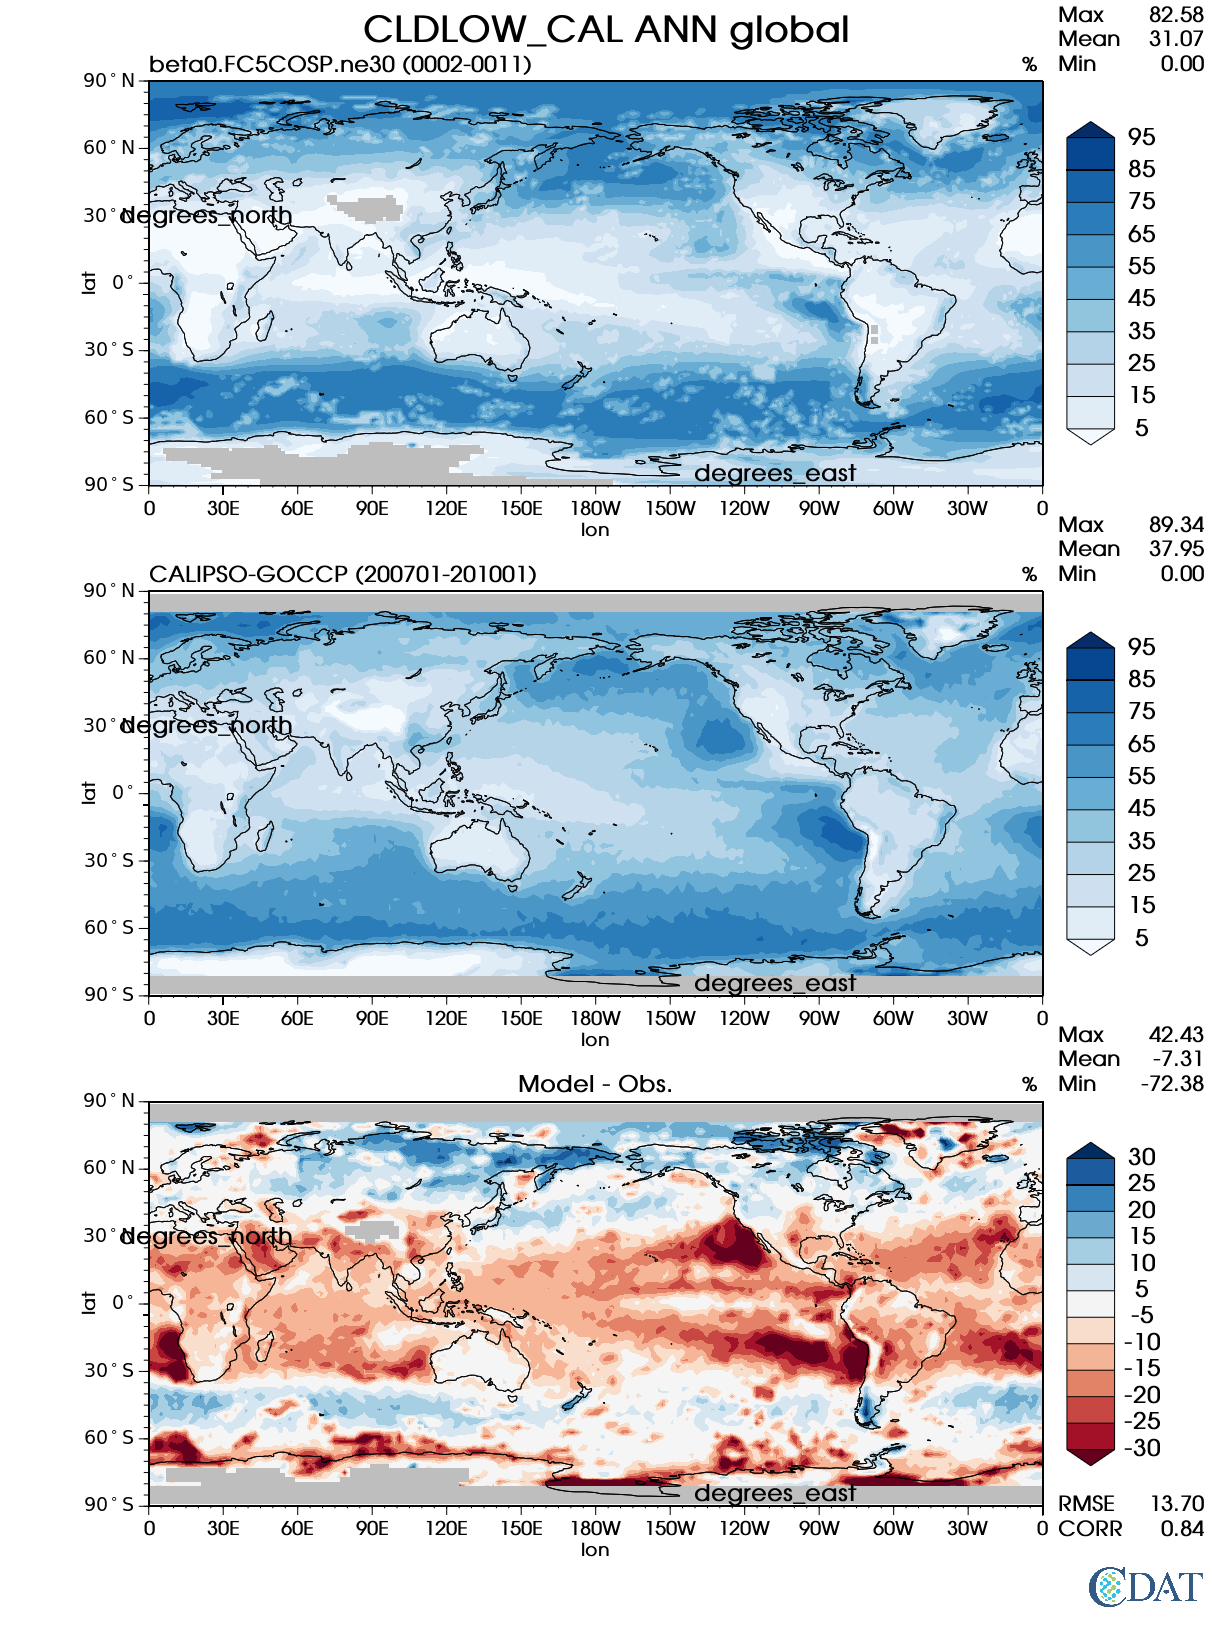
| Use this command to recreate this image: | e3sm_diags --no_viewer --short_test_name 'beta0.FC5COSP.ne30' --contour_levels '5' '15' '25' '35' '45' '55' '65' '75' '85' '95' --results_dir '/global/project/projectdirs/acme/www/zhang40/py2_model_obs_climo_vcs/' --diff_levels '-30' '-25' '-20' '-15' '-10' '-5' '5' '10' '15' '20' '25' '30' --backend 'vcs' --canvas_size_h '1628' --reference_colormap 'Blues' --reference_data_path '/global/project/projectdirs/acme/acme_diags/obs_for_e3sm_diags/climatology/' --main_title 'CLDLOW_CAL ANN global' --test_data_path '/global/project/projectdirs/acme/acme_diags/test_model_data_for_acme_diags/climatology/' --regions 'global' --test_colormap 'Blues' --regrid_method 'conservative' --variables 'CLDLOW_CAL' --figsize '8.5' '11.0' --ref_name 'CALIPSOCOSP' --run_type 'model_vs_obs' --regrid_tool 'esmf' --num_workers '4' --reference_name 'CALIPSO-GOCCP' --output_format 'png' --case_id 'Cloud Calipso' --granulate 'variables' 'seasons' 'regions' 'plevs' --test_name '20161118.beta0.FC5COSP.ne30_ne30.edison' --seasons 'ANN' --arrows --selectors 'sets' 'seasons' --diff_title 'Model - Obs.' --sets 'lat_lon' --diff_colormap 'RdBu' --canvas_size_w '1212' --dpi '150' |