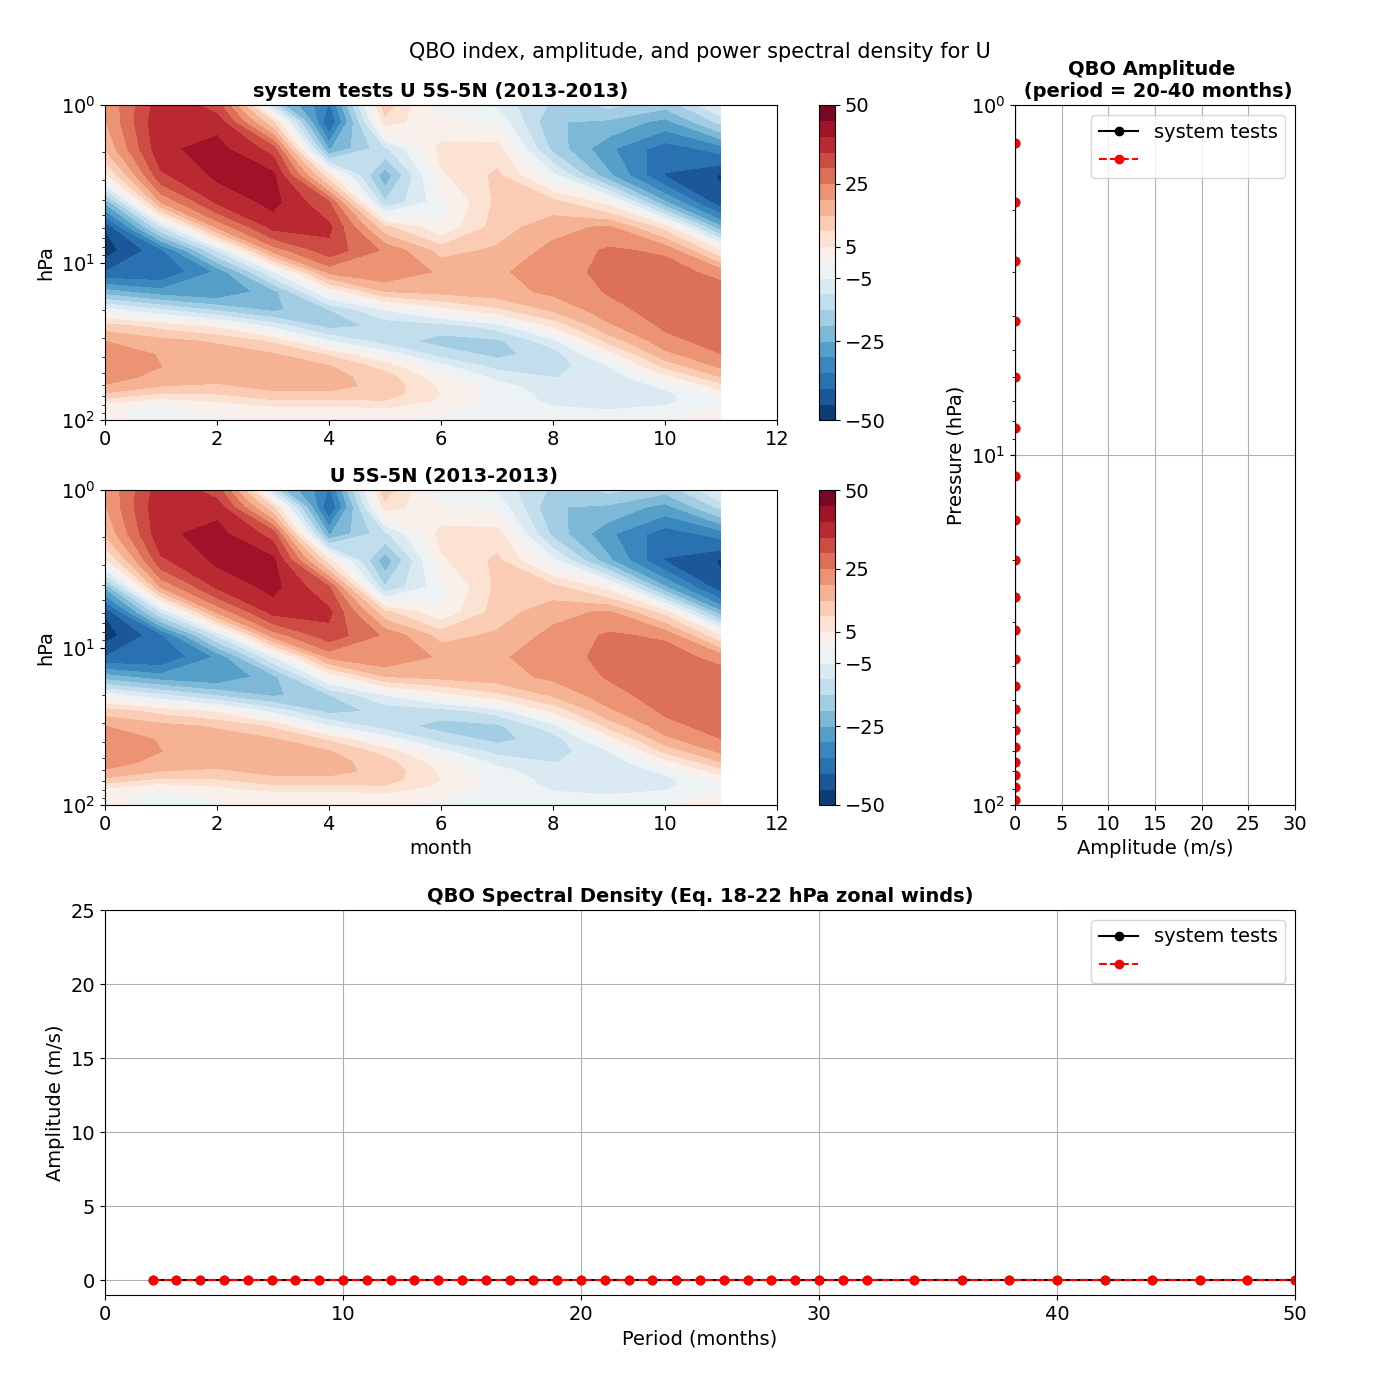
| Use this command to recreate this image: | e3sm_diags qbo --no_viewer --case_id 'qbo-test' --ref_timeseries_input --test_timeseries_input --sets 'qbo' --run_type 'model_vs_obs' --variables 'U' --seasons 'ANN' --regions 'global' --regrid_tool 'esmf' --regrid_method 'conservative' --main_title 'QBO index, amplitude, and power spectral density for U' --backend 'mpl' --output_format 'png' --canvas_size_w '1212' --canvas_size_h '1628' --figsize '8.5' '11.0' --dpi '150' --arrows --test_name 'system tests' --test_colormap 'cet_rainbow.rgb' --reference_colormap 'cet_rainbow.rgb' --diff_title 'Model - Observation' --diff_colormap 'diverging_bwr.rgb' --num_workers '4' --debug --granulate 'variables' 'plevs' 'regions' --selectors 'sets' 'seasons' --end_yr 2013 --ref_file 'U_201301_201312.nc' --reference_data_path '../unit_test_data' --results_dir 'all_sets_results_test' --start_yr 2013 --test_data_path '../unit_test_data' --test_file 'U_201301_201312.nc' --test_start_yr 2013 --ref_start_yr 2013 --test_end_yr 2013 --ref_end_yr 2013 |