CAM5.control.F2000.10yr winter
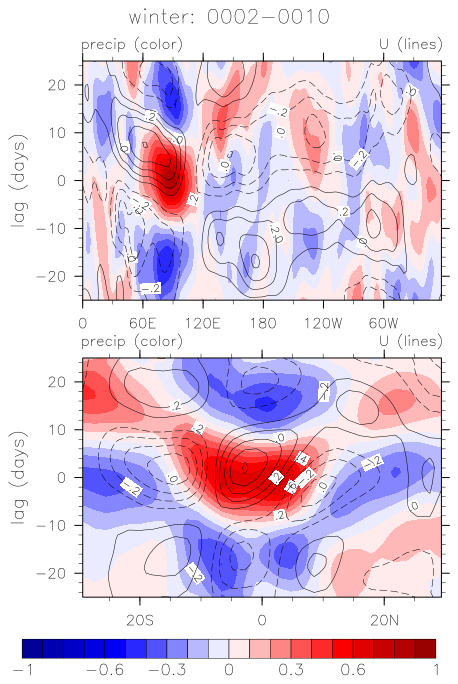
ERA-Interim winter

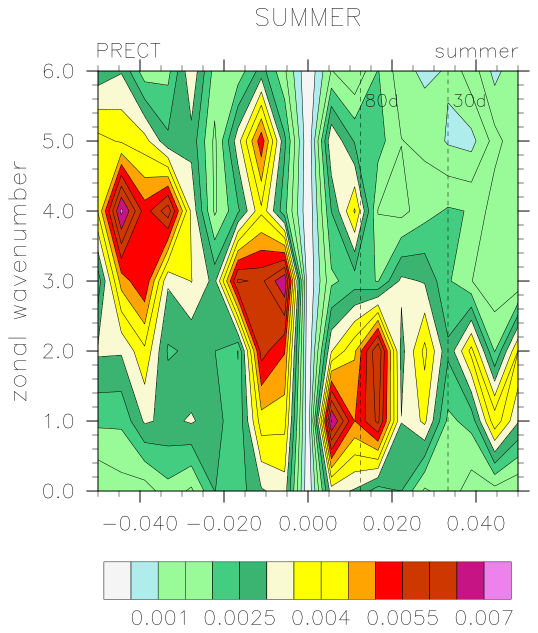
CAM5.control.F2000.10yr summer

ERA-Interim summer

CAM5.control.F2000.10yr annual

ERA-Interim annual

Wheeler-Kiladis spectra + CLIVAR-MJO suite (lag cross-correlation, combined EOF, composite life cycle, seasonal wavenumber-frequency). Daily/6-hourly model output; anomalies = smoothed-climatology removed, 20-100 day band-pass. Obs reference = ERA-Interim (US-CLIVAR MJO-suite / MDTF digest) for OLR & winds + TRMM for precip (NOT the ERA5 used on the climatology page). model obs = ERA-Interim / TRMM
Eastward tilt = eastward MJO propagation; precip (color), U850 (contours).
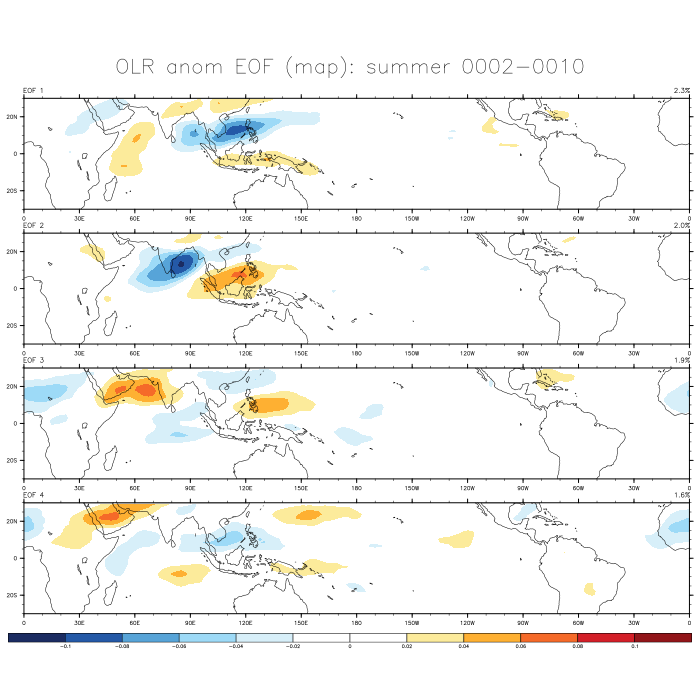
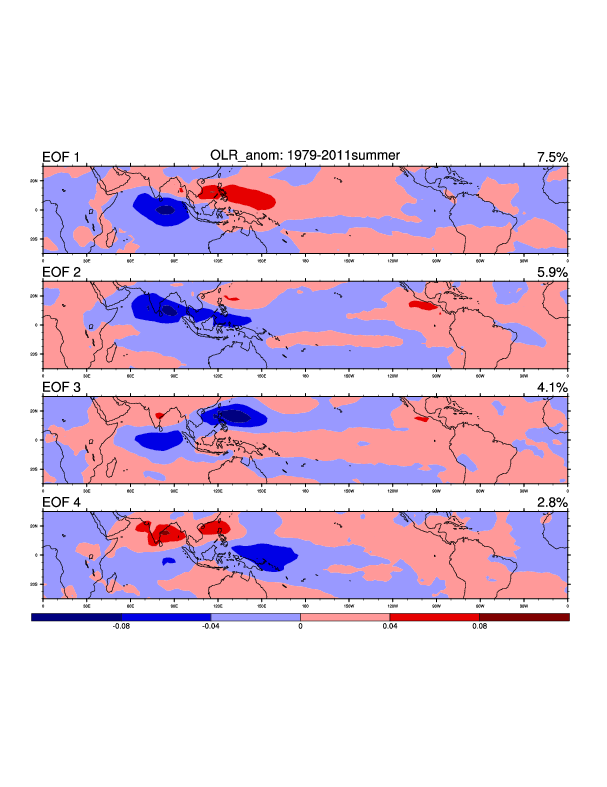
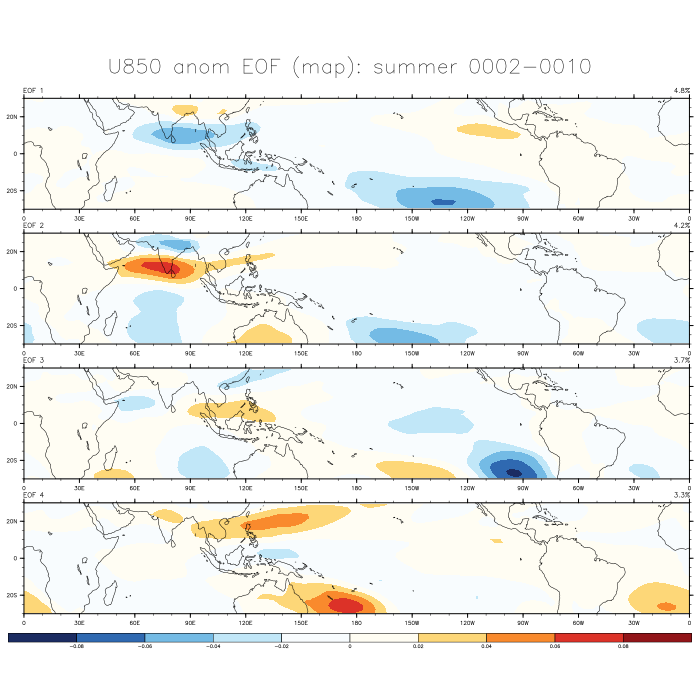
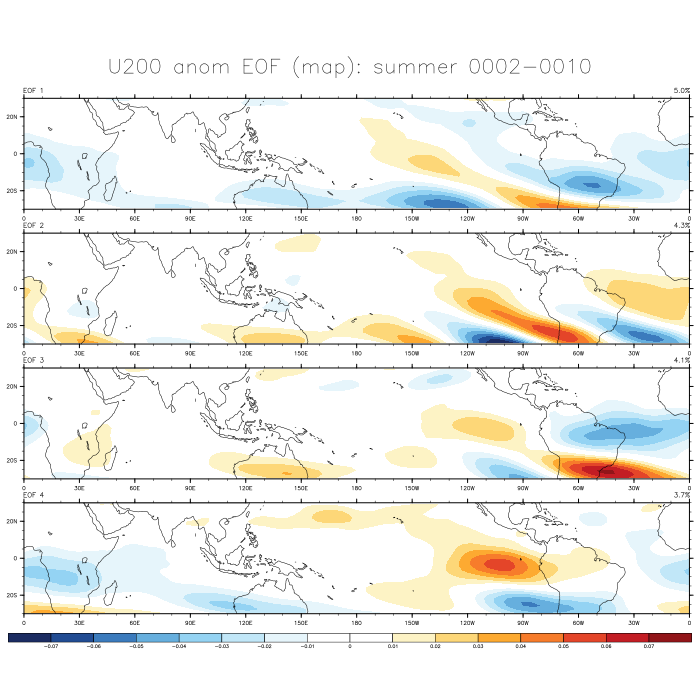
Top: combined multivariate EOF1 & EOF2 (the MJO mode pair, longitudinal structure). Below: per-variable seasonal EOF spatial maps — model vs ERA.

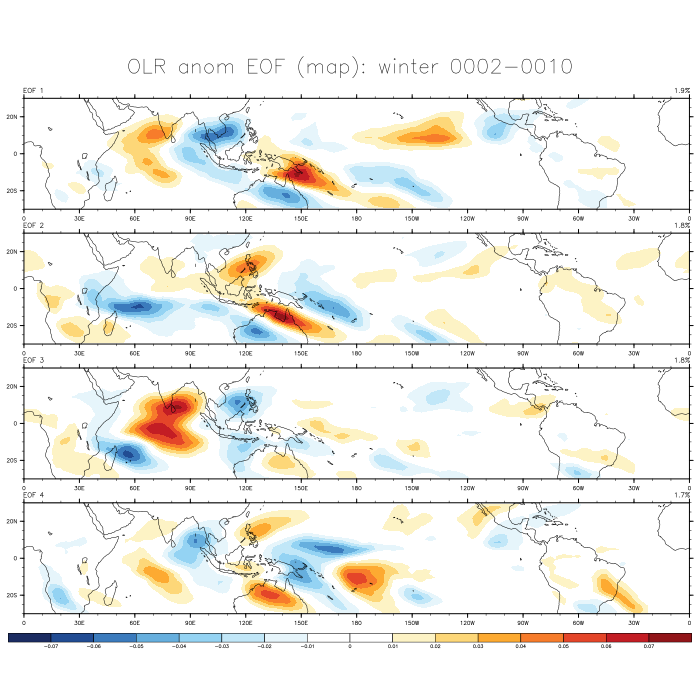

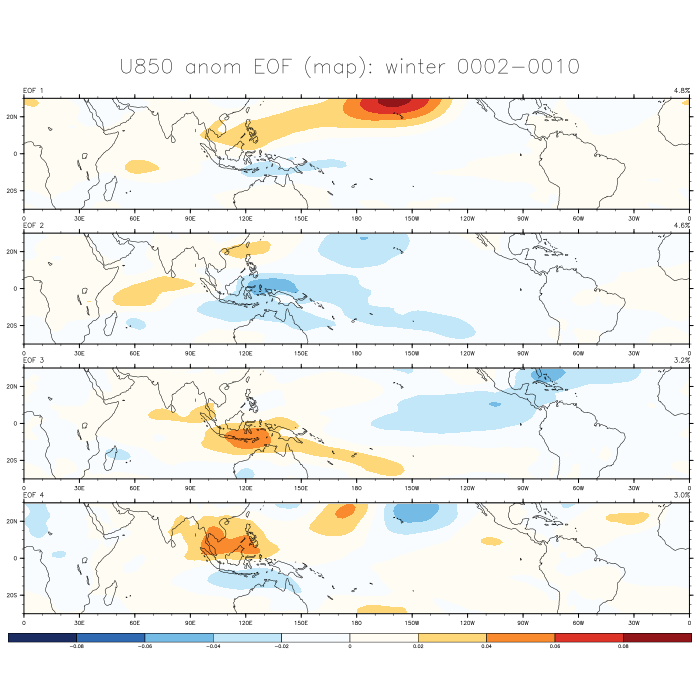

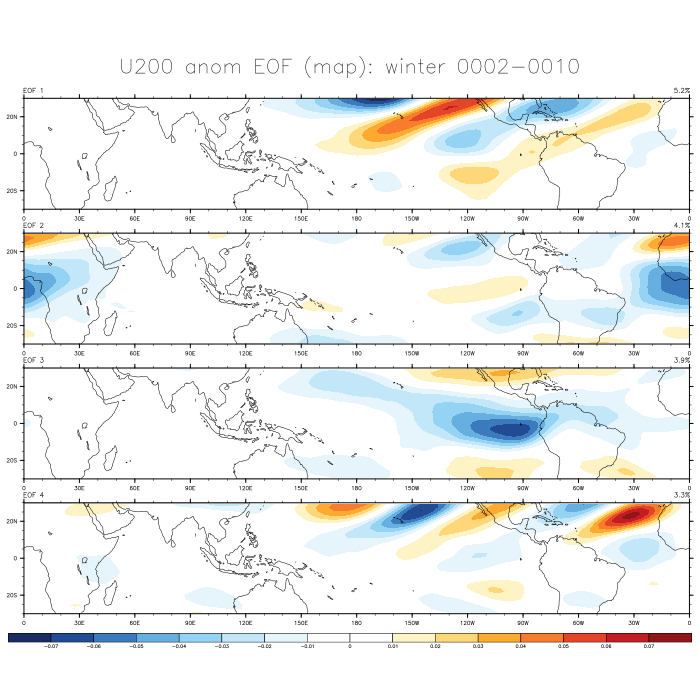




Eastward (positive freq) MJO band at wavenumber 1, 30-80 day.
Winter: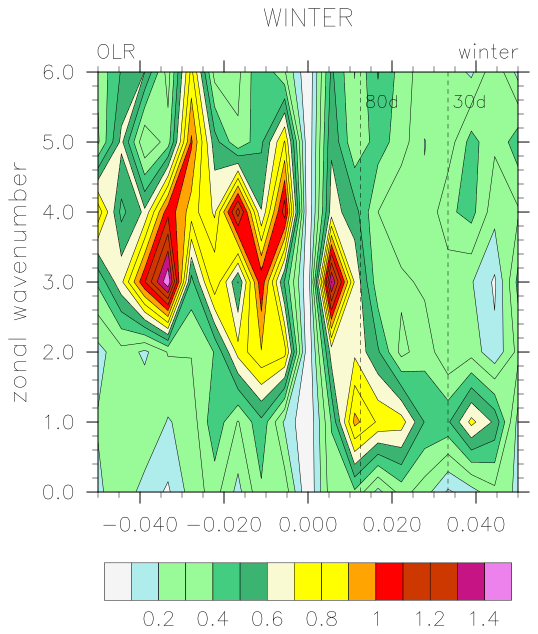


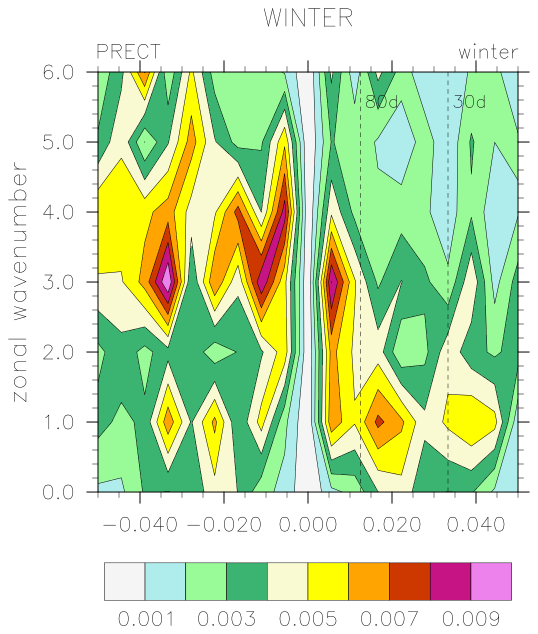

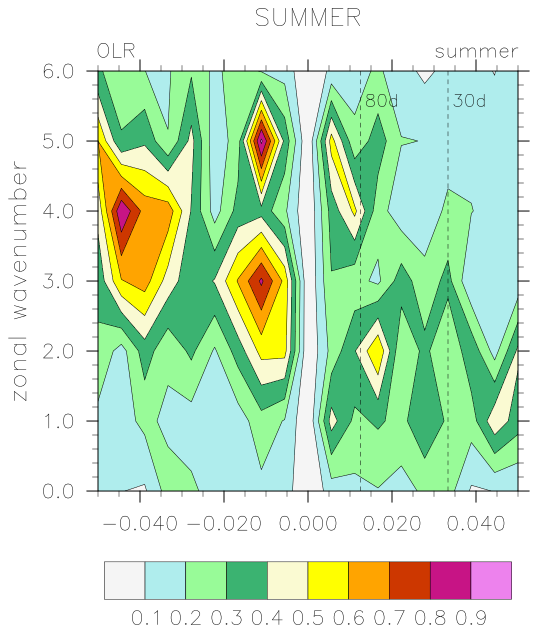

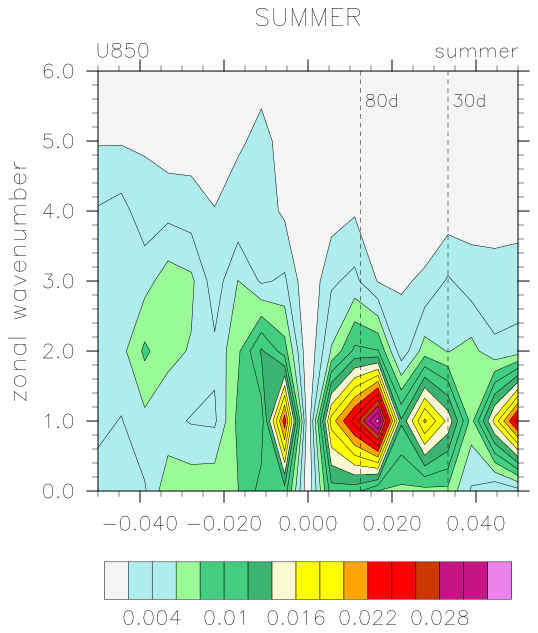



Full Wheeler-Kiladis wavenumber-frequency spectra (raw/background/normalized, sym+asym, vs NOAA/NCEP obs) plus the MJO index line plots, χ200 velocity-potential Hovmöller, and precip-rate histogram are on the diagnostic-package pages:
Generated by run_vardiag.sh. Case=CAM5.control.F2000.10yr. Obs ERA/TRMM reused from xsongsio (E3SM).