Marker-based classification features#
To classify a given sequence into chromosome, plasmid, or virus with the marker-based classifier, geNomad performs gene prediction using pyrodigal-gv and assigns the predicted proteins to geNomad’s markers using MMseqs2. From the sequence’s gene structure, RBS motifs, and the identity of the markers that were assigned to its proteins, a series of numerical features are computed and used as input for the classification model.
geNomad’s marker dataset#
Most of these features used for classification are computed from the specificity profile of the markers assigned to the genes encoded by a sequence. Each one of geNomad’s 227,897 markers has three associated SPM values that range from 0 to 1 and measure how specific that marker is to each one of the three classes (chromosome, plasmid, and virus). For instance:
Marker |
Chromosome SPM |
Plasmid SPM |
Virus SPM |
|---|---|---|---|
GENOMAD.109995.PP |
0.0594 |
0.9982 |
0.0000 |
GENOMAD.109996.VV |
0.0039 |
0.0000 |
1.0000 |
The GENOMAD.109995.PP marker is very plasmid-specific, as its plasmid SPM is close to 1, while its chromosome and virus SPM values are close to 0. On the other hand, the GENOMAD.109996.VV marker demonstrates high specificity towards viruses, with a high virus SPM and low chromosome and plasmid SPM values.
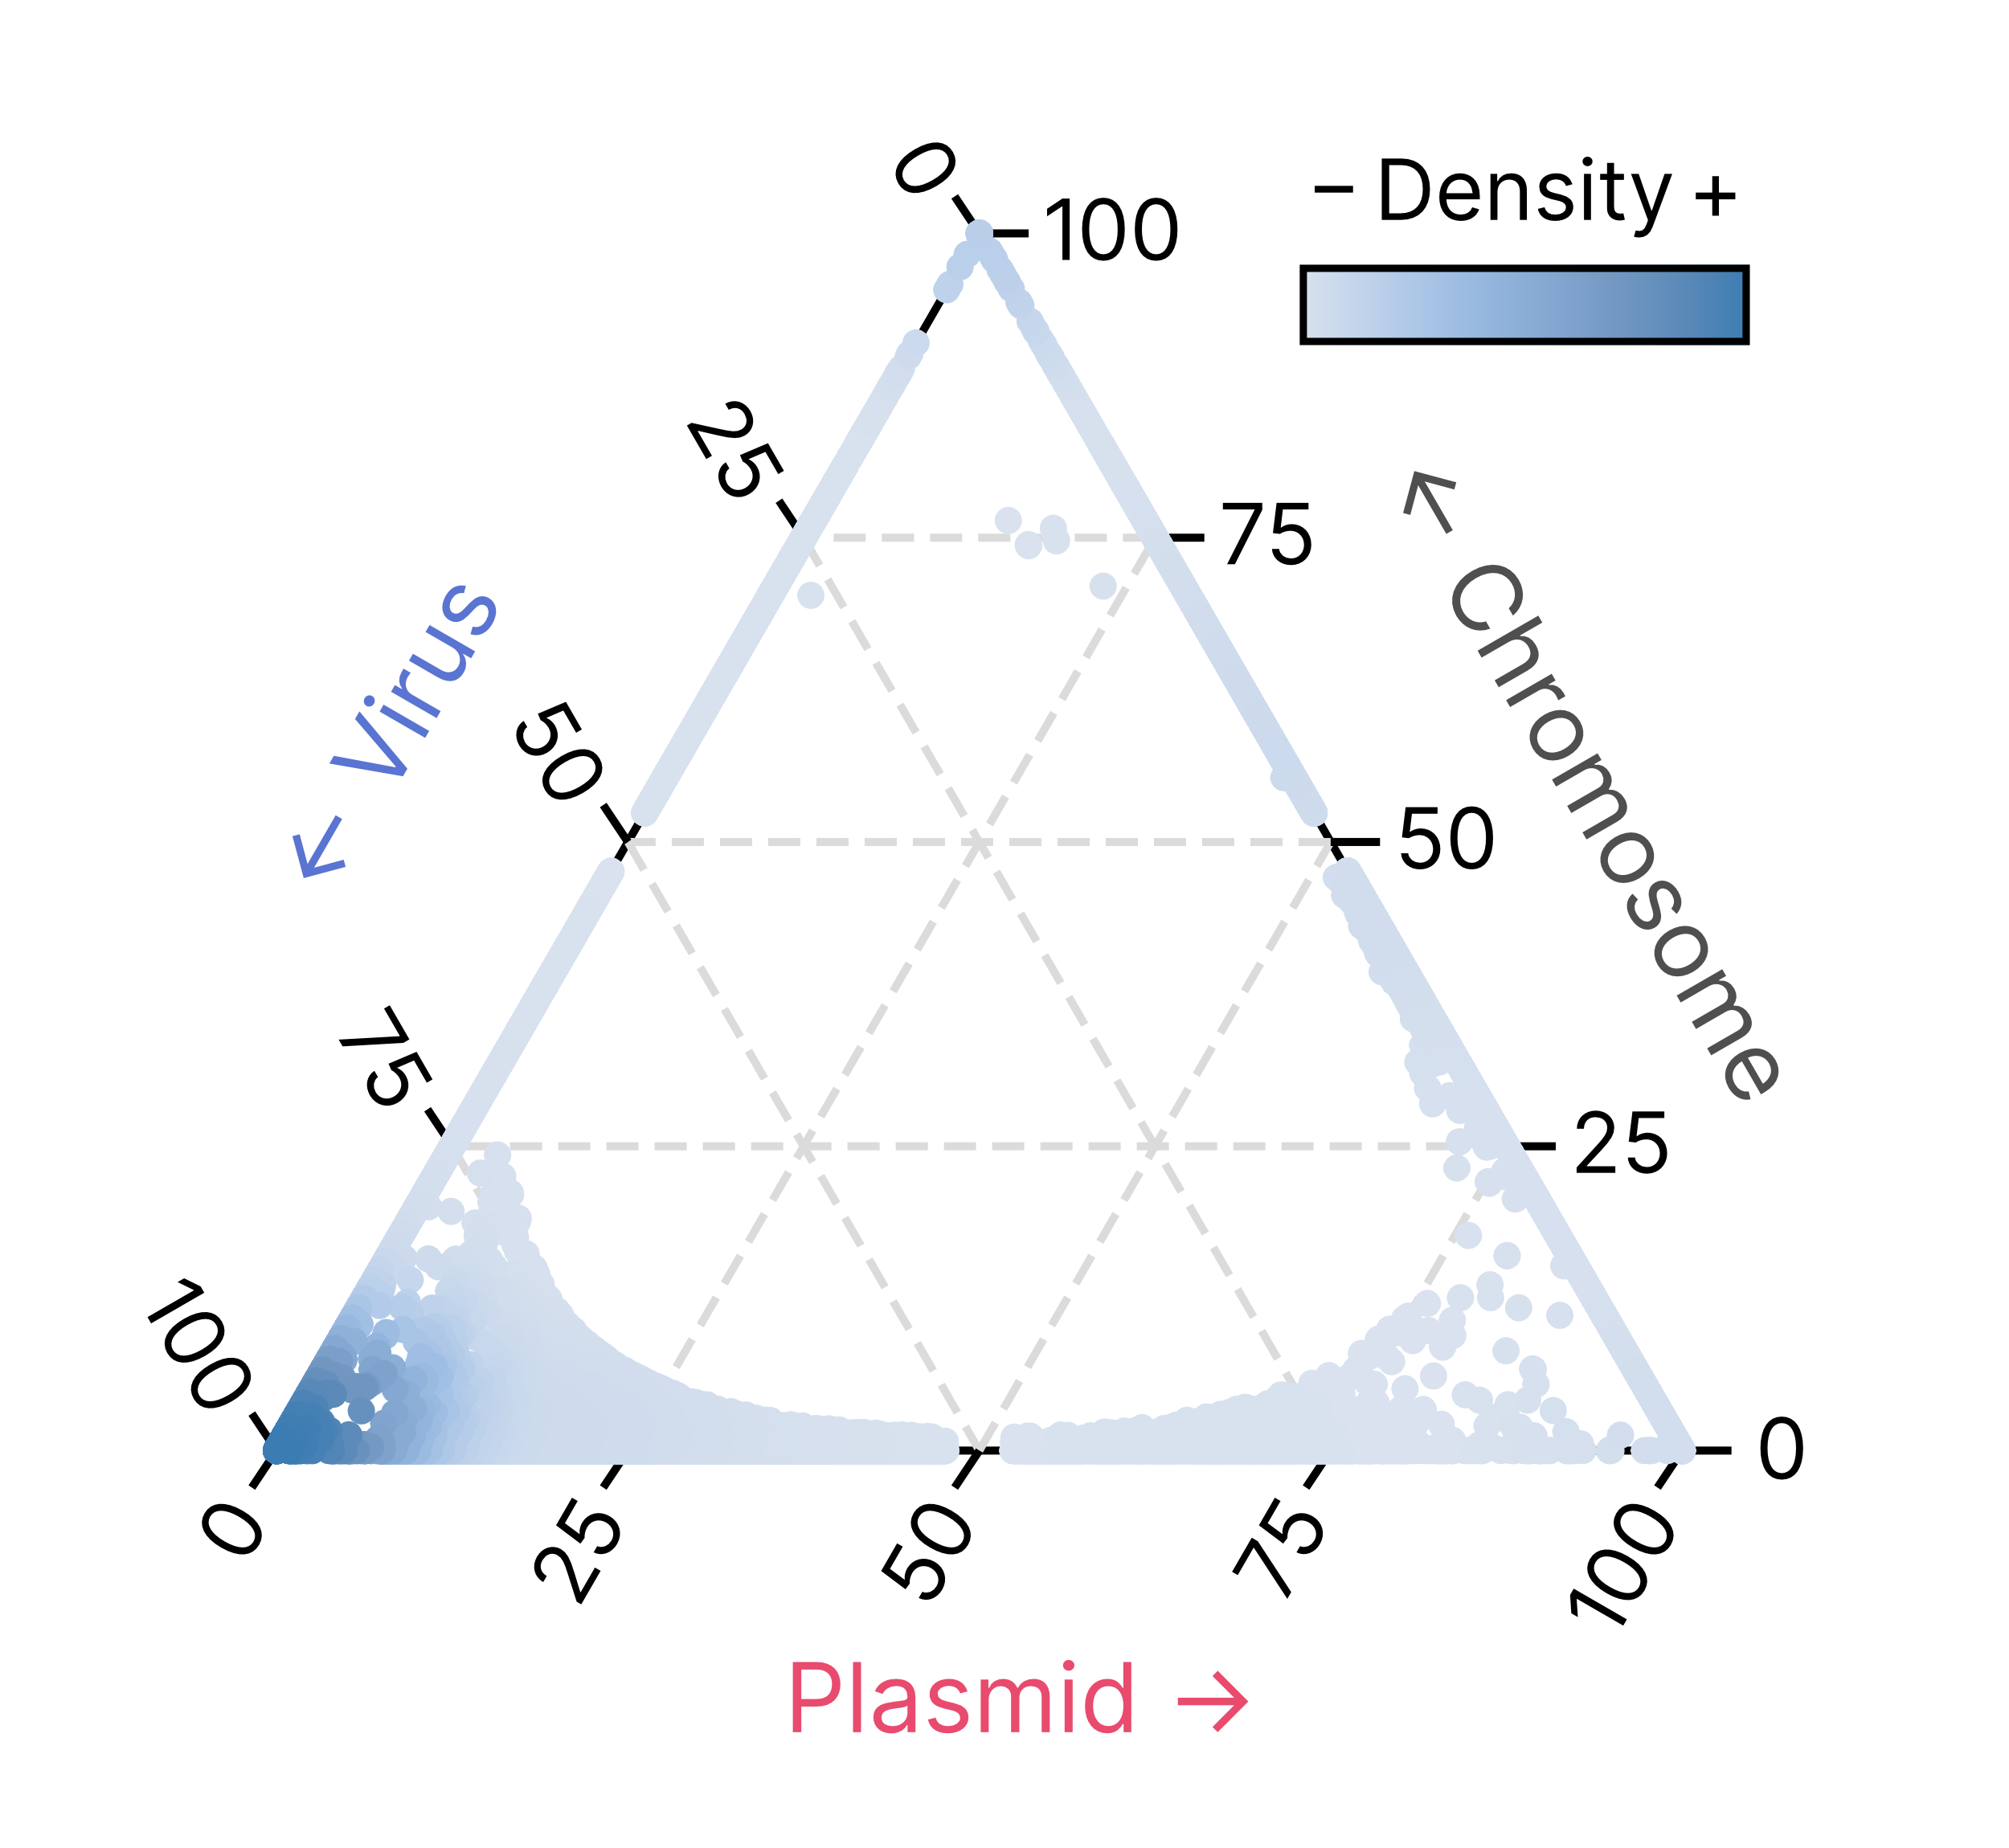
The specificity distribution of all geNomad markers is represented in the ternary plot below. The position of each marker (circles) is determined by its specificity, and the colors represent the marker density in a given region of the plot. Markers that are closer to the triangle’s vertices are strongly specific to one of the classes.
Based on their specificity profile, markers are assigned to one of nine classes:
Specificity class |
Chromosome SPM |
Plasmid SPM |
Virus SPM |
|---|---|---|---|
CC |
High |
Low |
Low |
CP |
High |
Medium |
Low |
CV |
High |
Low |
Medium |
PC |
Medium |
High |
Low |
PP |
Low |
High |
Low |
PV |
Low |
High |
Medium |
VC |
Medium |
Low |
High |
VP |
Low |
Medium |
High |
VV |
Low |
Low |
High |
Classification features#
A total of 25 features are used to perform marker-based classification:
strand_switch_rate: The fraction of genes located on a different strand from the gene upstream.coding_density: Sum of the lengths of all the protein-coding regions (in base pairs) divided by the total sequence length.no_rbs_freq: Fraction of genes without a detectable RBS motif.sd_bacteroidetes_rbs_freq: Fraction of genes predicted to have a Bacteroidetes Shine-Dalgarno RBS motif (TAA, TAAA, TAAAA, TAAAT, TAAAAA, TAAAAT).sd_canonical_rbs_freq: Fraction of genes predicted to have a canonical Shine-Dalgarno RBS motif (3Base/5BMM, 4Base/6BMM, AGG, AGGA, AGGA/GGAG/GAGG, AGGAG, AGGAG/GGAGG, AGGAG(G)/GGAGG, AGGAGG, AGxAG, AGxAGG/AGGxGG, GAG, GAGG, GAGGA, GGA, GGA/GAG/AGG, GGAG, GGAG/GAGG, GGAGG, GGAGGA, GGxGG).tatata_rbs_freq: Fraction of genes predicted to have a TATATA RBS motif (ATA, ATAT, ATATA, ATATAT, TAT, TATA, TATAT, TATATA).cc_marker_freq: Number of genes assigned to the CC specificity class (high chromosome SPM, low plasmid SPM, low virus SPM) divided by the total number of genes.cp_marker_freq: Number of genes assigned to the CP specificity class divided by the total number of genes.cv_marker_freq: Number of genes assigned to the CV specificity class divided by the total number of genes.pc_marker_freq: Number of genes assigned to the PC specificity class divided by the total number of genes.pp_marker_freq: Number of genes assigned to the PP specificity class divided by the total number of genes.pv_marker_freq: Number of genes assigned to the PV specificity class divided by the total number of genes.vc_marker_freq: Number of genes assigned to the VC specificity class divided by the total number of genes.vp_marker_freq: Number of genes assigned to the VP specificity class divided by the total number of genes.vv_marker_freq: Number of genes assigned to the VV specificity class divided by the total number of genes.c_marker_freq: Total chromosome marker frequency \((\textrm{CC} + \textrm{CP} + \textrm{CV})\).p_marker_freq: Total plasmid marker frequency \((\textrm{PC} + \textrm{PP} + \textrm{PV})\).v_marker_freq: Total virus marker frequency \((\textrm{VC} + \textrm{VP} + \textrm{VV})\).median_c_spm: Median chromosome SPM across all annotated genes.median_p_spm: Median plasmid SPM across all annotated genes.median_v_spm: Median virus SPM across all annotated genes.v_vs_c_score_logistic: A sigmoid function is applied to a compound score \(\left(\sum _{i=1}^n\:\textrm{V SPM}_i-\textrm{C SPM}_i\right)\) to put it in the \([0-1]\) range.v_vs_p_score_logistic: A sigmoid function is applied to a compound score \(\left(\sum _{i=1}^n\:\textrm{V SPM}_i-\textrm{P SPM}_i\right)\) to put it in the \([0-1]\) range.p_vs_v_score_logistic: A sigmoid function is applied to a compound score \(\left(\sum _{i=1}^n\:\textrm{P SPM}_i-\textrm{C SPM}_i\right)\) to put it in the \([0-1]\) range.gv_marker_freq: Number of genes annotated with giant virus markers divided by the total number of genes.
Some notes on the classification features
Predicted RBS motifs are extracted from
pyrodigal-gv’s gene prediction.Markers were assigned to the nine specificity classes (CC, CP, CV, PC, PP, PV, VC, VP, and VV) based on their SPM values. Briefly, we used the
binned_statistic_ddfunction from SciPy to split the three-dimensional SPM space into 125 equally sized bins. Next, each marker was assigned to a bin based on its SPM profile, so that all the markers within a given bin had similar chromosome, plasmid, and virus SPMs. Finally, we manually labeled each bin, and the markers within it, with the nine specificity classes, depending on their SPM profiles.To label profiles as giant virus markers, we treated giant viruses (Nucleocytoviricota, Pandoravirus, Mollivirus, Pithoviridae, Naldaviricetes) as a fourth class, separate from all other viruses, and recomputed SPM values. Profiles with giant virus \(SPM ≥ 0.94\) were considered giant virus markers. This threshold was picked based on the SPM of profiles of known Megaviricetes capsid proteins.