Score calibration#
geNomad’s classification models generate scores that indicate how confident they are in their predictions. However, these scores do not represent the true underlying probabilities of the predictions being correct. For example, if the same classification model is used to identify viruses in a metagenome (where cellular sequences outnumber viral sequences) and in a virome (that is enriched in viral sequences), it is expected that the model will yield a higher proportion of false positive viruses in the metagenome, where more cellular sequences (that are prone to be misclassified as viruses) will be present.

This is because models assign the same score to a given sequence regardless of the sample’s composition. To tackle this issue, geNomad has an optional calibration mechanism that uses sample composition data to estimate the true underlying probabilities. This feature can be enabled by using the --enable-score-calibration parameter of the end-to-end command.
Score calibration algorithm#
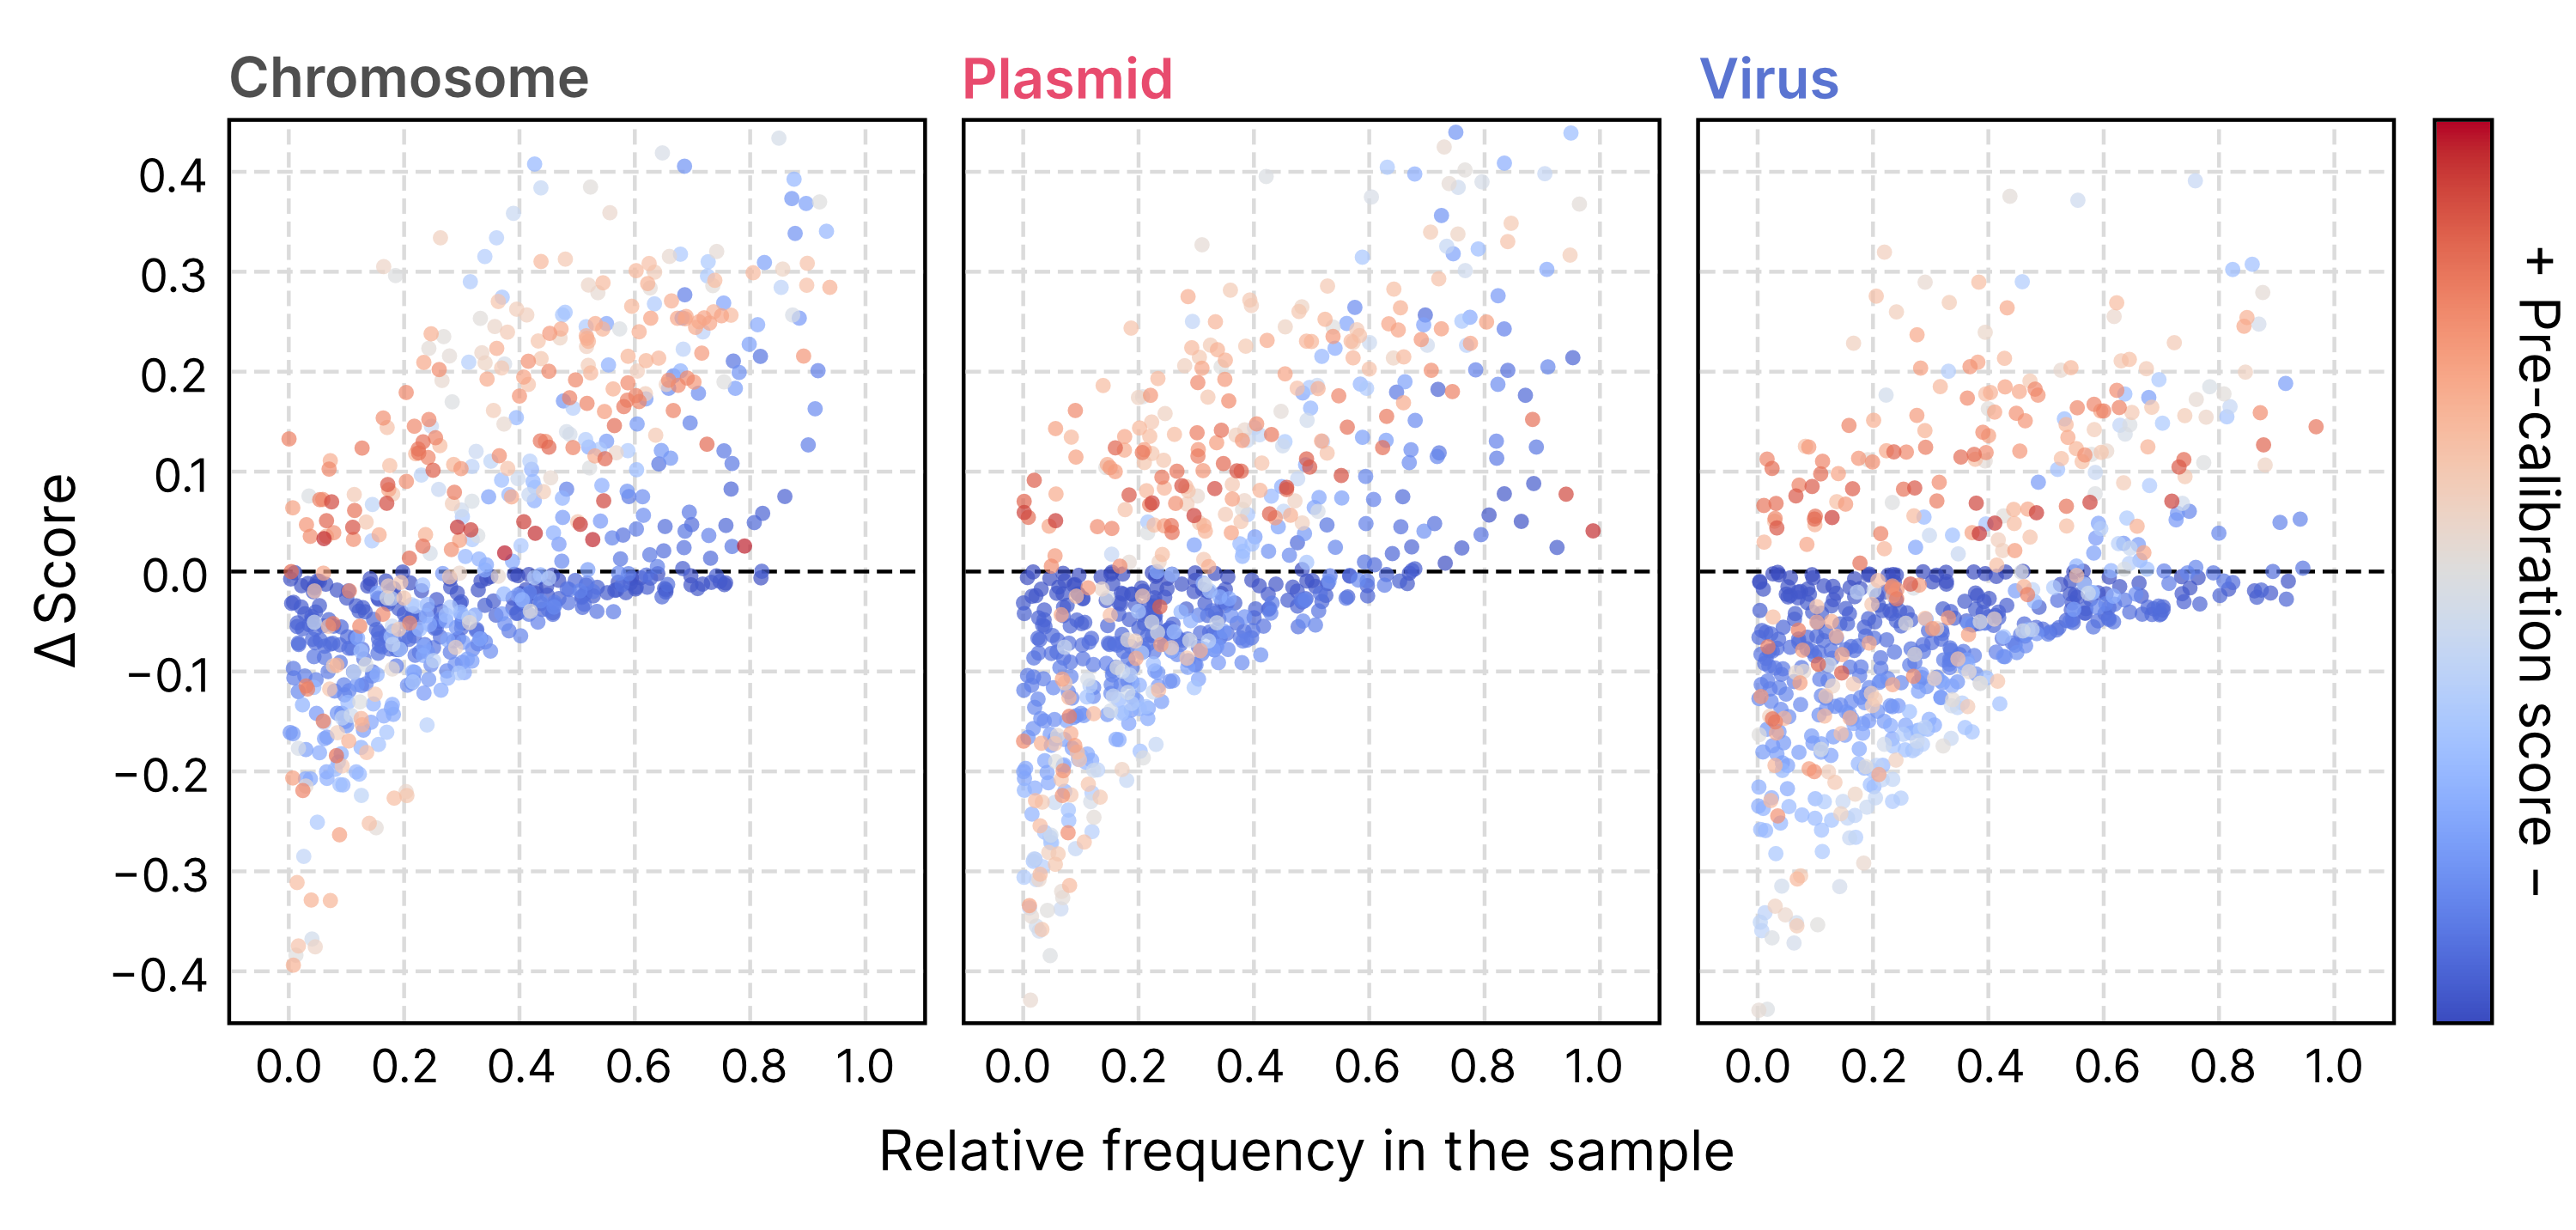
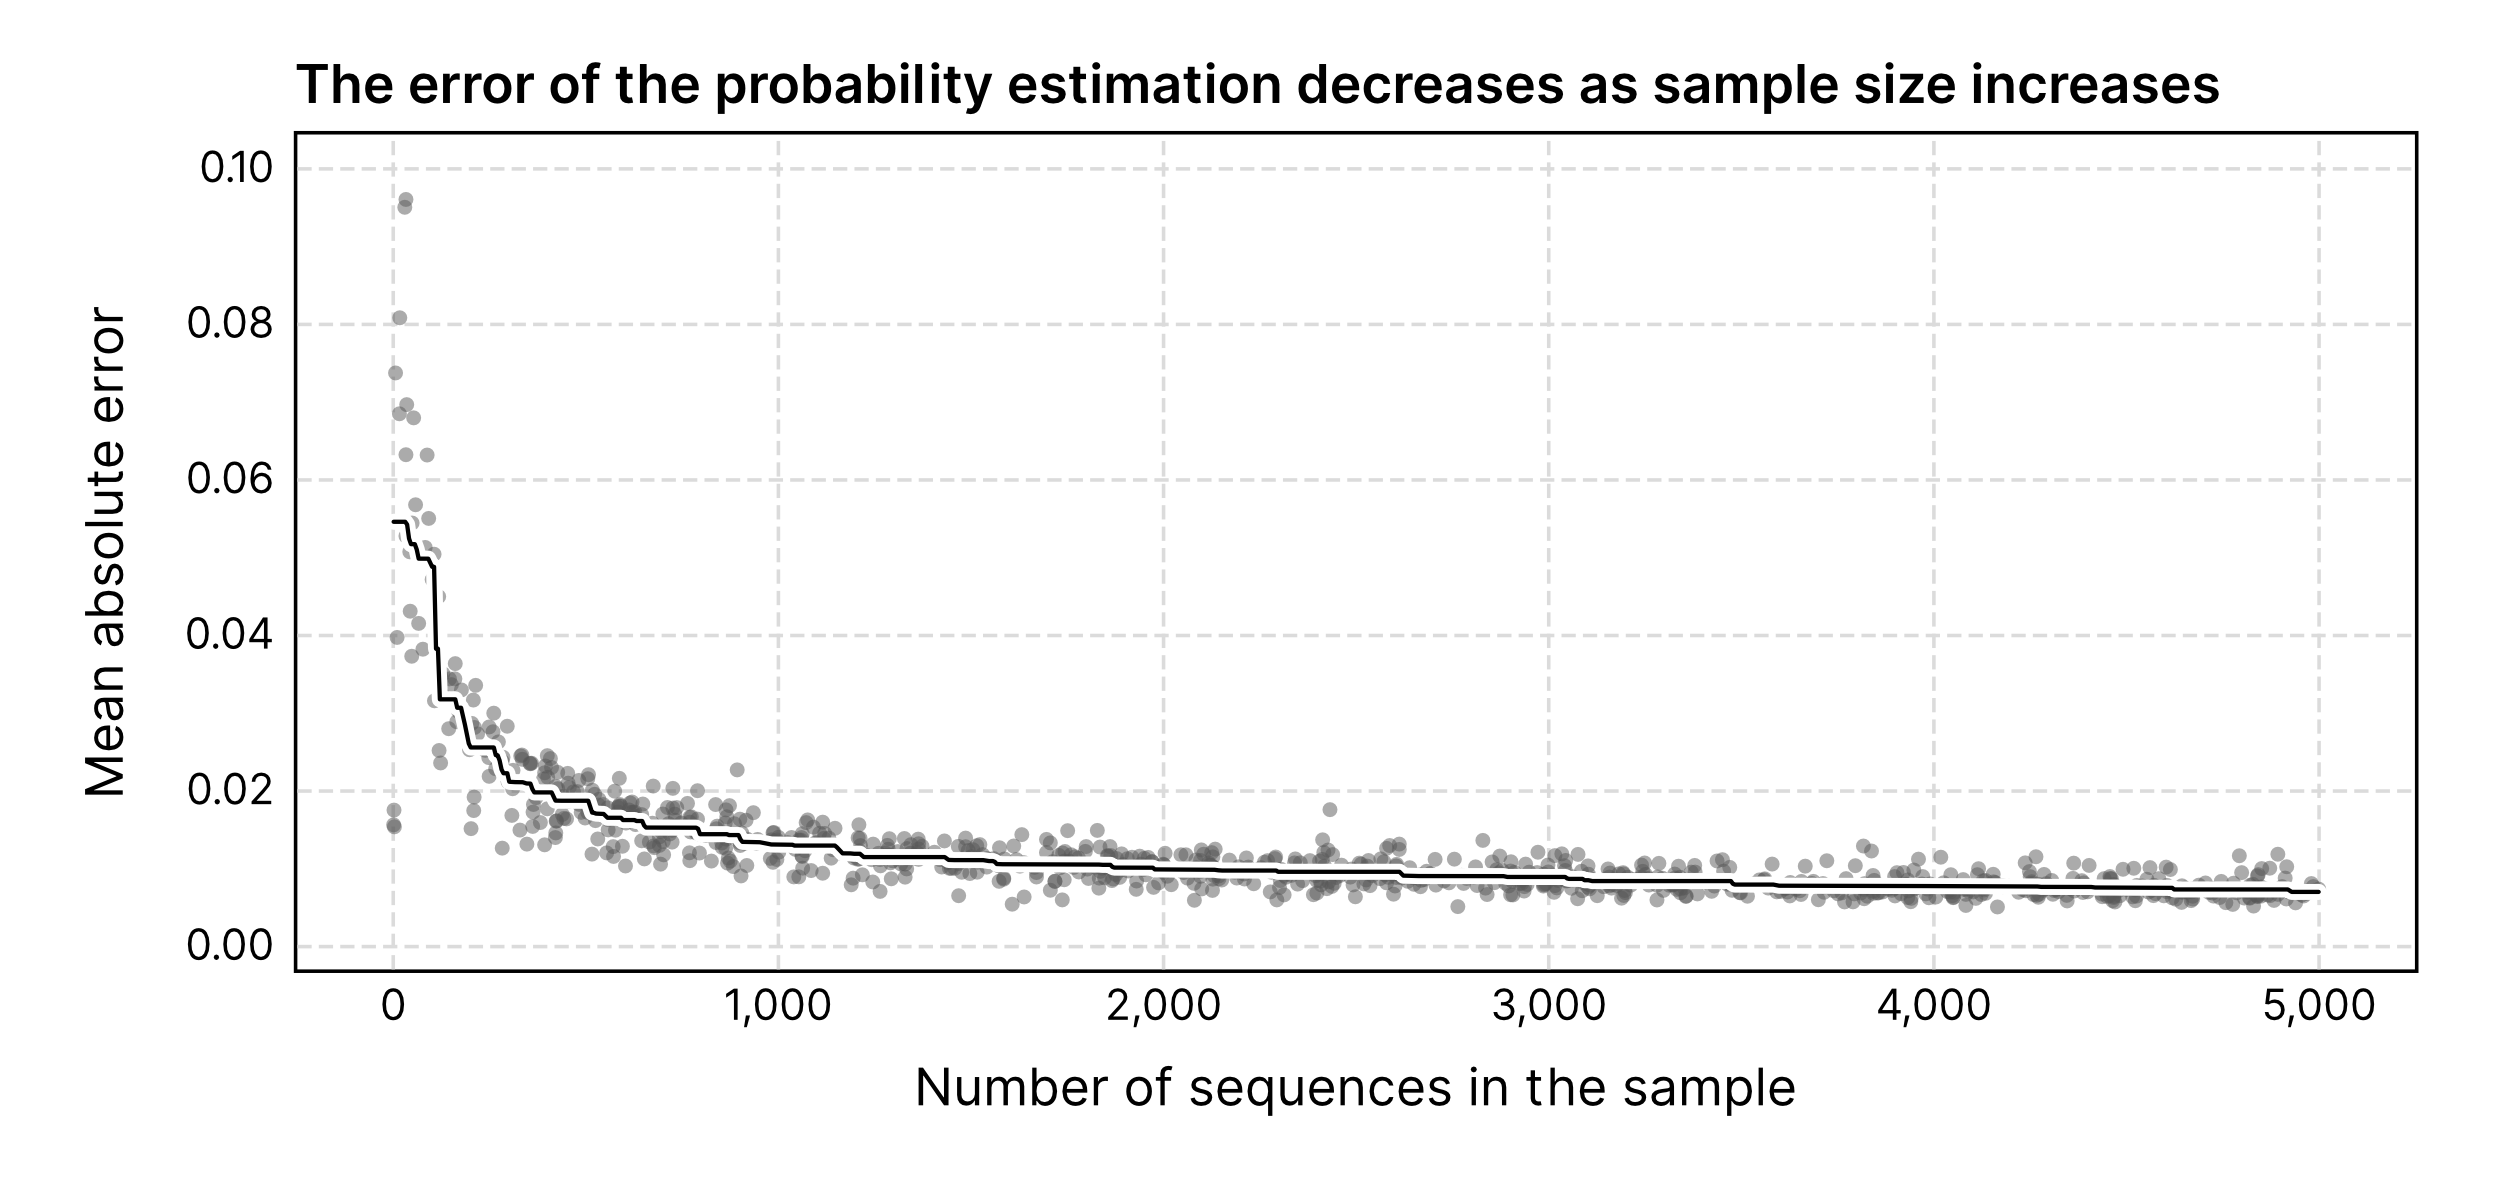
The algorithm used for score calibration consists of a dense neural network that takes raw scores and the empirical sample composition (that is, the frequency of chromosomes, plasmids, and viruses in the pre-calibration classification) as inputs and outputs calibrated scores that approximate probabilities accurately (mean absolute errors, or MAE, in the figure below).

In essence, the calibration mechanism adjusts raw scores by reducing or increasing the scores of a given class (chromosome, plasmid, or virus) when its frequency within the sample is low or high. When the sample composition is very uneven, this tends to result in large changes in raw scores.
The calibrated scores produced by geNomad offer users two benefits:
Estimated probabilities can be used to compute false discovery rates, allowing users to make more informed decisions (e.g., setting a threshold to achieve a desired proportion of false positives).
Improved classification performance by adjusting the assigned labels of some sequences after calibrating scores.
Because this process depends on reliable estimates of the underlying compositions, it works best for samples with sufficient size (e.g. ≥ 1,000 sequences). geNomad will automatically disable calibration if the input file contains less than 1,000 sequences.
False discovery rate computation#
By converting scores to approximate probabilities, geNomad can compute the estimated number of false positives in a set of predicted plasmids or viruses.
Sequence |
Calibrated virus score |
False discovery rate |
|---|---|---|
Virus 1 |
0.9753 |
0.0247 |
Virus 2 |
0.9501 |
0.0373 |
Virus 3 |
0.9442 |
0.0435 |
Virus 4 |
0.9101 |
0.0551 |
Virus 5 |
0.8843 |
0.0672 |
Virus 6 |
0.8577 |
0.0797 |
Virus 7 |
0.7912 |
0.0982 |
Virus 8 |
0.7449 |
0.1178 |
Virus 9 |
0.6501 |
0.1436 |
In the table above, viruses are ordered by their probability. If you select only the viruses with probability above 90% (that is, the first four rows), the expected proportion of false positives would be around 5.5%. In a scenario where you select all the viruses in the table, the expected proportion of false positives is 14.4%, which means that the expected number of false positives in your sample is 1.3 \((\approx 9 * 0.1436)\).
Example#
Suppose you’re using geNomad to identify viruses in a sample by classifying its sequences. One of the sequences in the sample obtained the following scores:
Chrom. score |
Plasm. score |
Virus score |
|---|---|---|
0.0940 |
0.2602 |
0.6458 |
Since the virus score is higher, you could conclude that it’s likely a viral sequence. But how likely is it?
To answer this question, you would need to know the composition of the sample, i.e., what proportion of its sequences are chromosomal, plasmid, or viral. The interpretation of the scores is affected by the sample composition, as demonstrated by two scenarios: a metagenome with mostly cellular sequences and a virome consisting mostly of viral sequences. In a metagenome, a higher proportion of the sequences classified as viruses are false positives, due to the greater number of cellular sequences that are susceptible to misclassification. Conversely, in a virome, there are fewer misclassified sequences among the identified viruses (as represented in this figure).
Thus, even though your sequence might receive the same scores across different executions, the actual probability of it being a virus depends on the sample’s context. Unfortunately, it’s impossible to know the sample composition beforehand. However, geNomad can estimate sample composition quite accurately using its own classification results. Therefore, you can use geNomad to calibrate the raw scores and obtain reliable estimates of the probability that your sequence of interest is a virus. In the two hypothetical scenarios mentioned above, you’d get different probabilities:
Composition |
Chrom. score |
Plasm. score |
Virus score |
|---|---|---|---|
No calibration |
0.0940 |
0.2602 |
0.6458 |
Metagenome |
0.4438 |
0.0033 |
0.5529 |
Virome |
0.0257 |
0.0004 |
0.9739 |