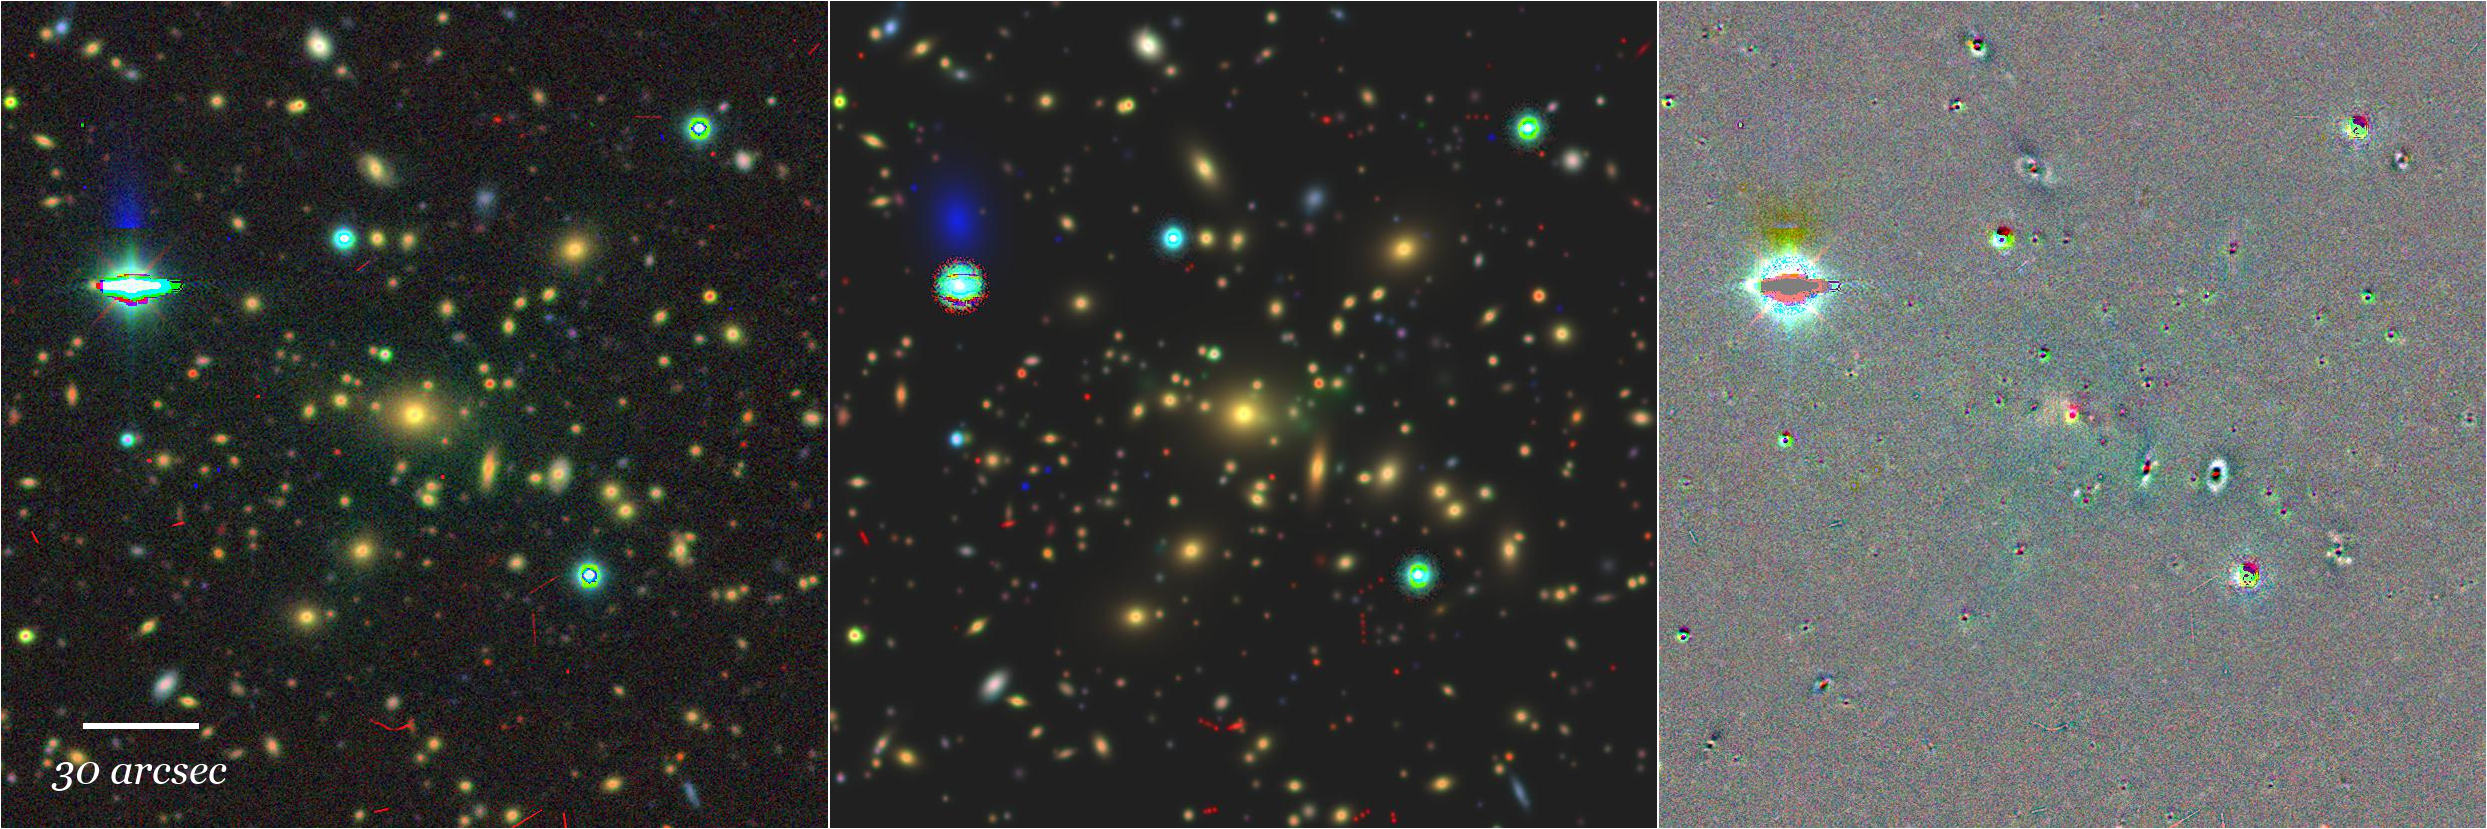
Color mosaics showing the data (left panel), model (middle panel), and residuals (right panel).
|
| Tractor | ID | Ellipse Moments | Ellipse Fitting | |||||||||||||
|---|---|---|---|---|---|---|---|---|---|---|---|---|---|---|---|---|
| ID | Type | n | r(50) (arcsec) | PA (deg) | e | R(25) (arcsec) | PA (deg) | e | Size (arcsec) | PA (deg) | e | R(24) (arcsec) | R(25) (arcsec) | R(26) (arcsec) | PA (deg) | e |
| 25032419 | DEV | 4.00 | 4.438 | 98.04 | 0.149 | ... | ... | ... | ... | ... | ... | ... | ... | ... | ... | ... |
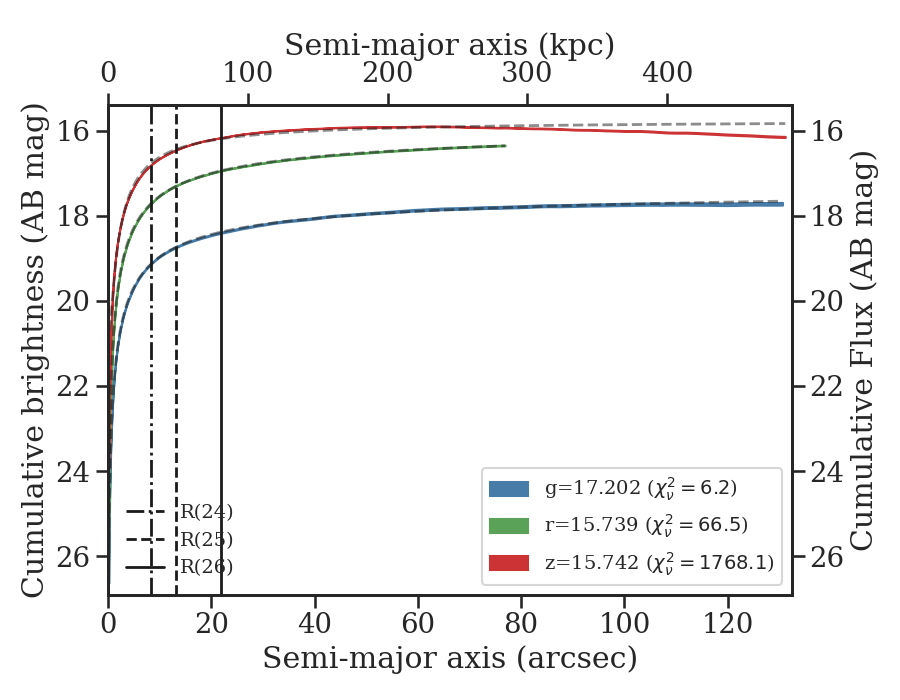
| Curve of Growth | ||||||||||||||||
|---|---|---|---|---|---|---|---|---|---|---|---|---|---|---|---|---|
| Tractor | < R(24) arcsec |
< R(25) arcsec |
< R(26) arcsec |
Integrated | ||||||||||||
| ID | Galaxy | g | r | z | g | r | z | g | r | z | g | r | z | g | r | z |
| 25032419 | 17.905 | 16.448 | 15.700 | ... | ... | ... | ... | ... | ... | ... | ... | ... | ... | ... | ... | |
 |
 |
 |
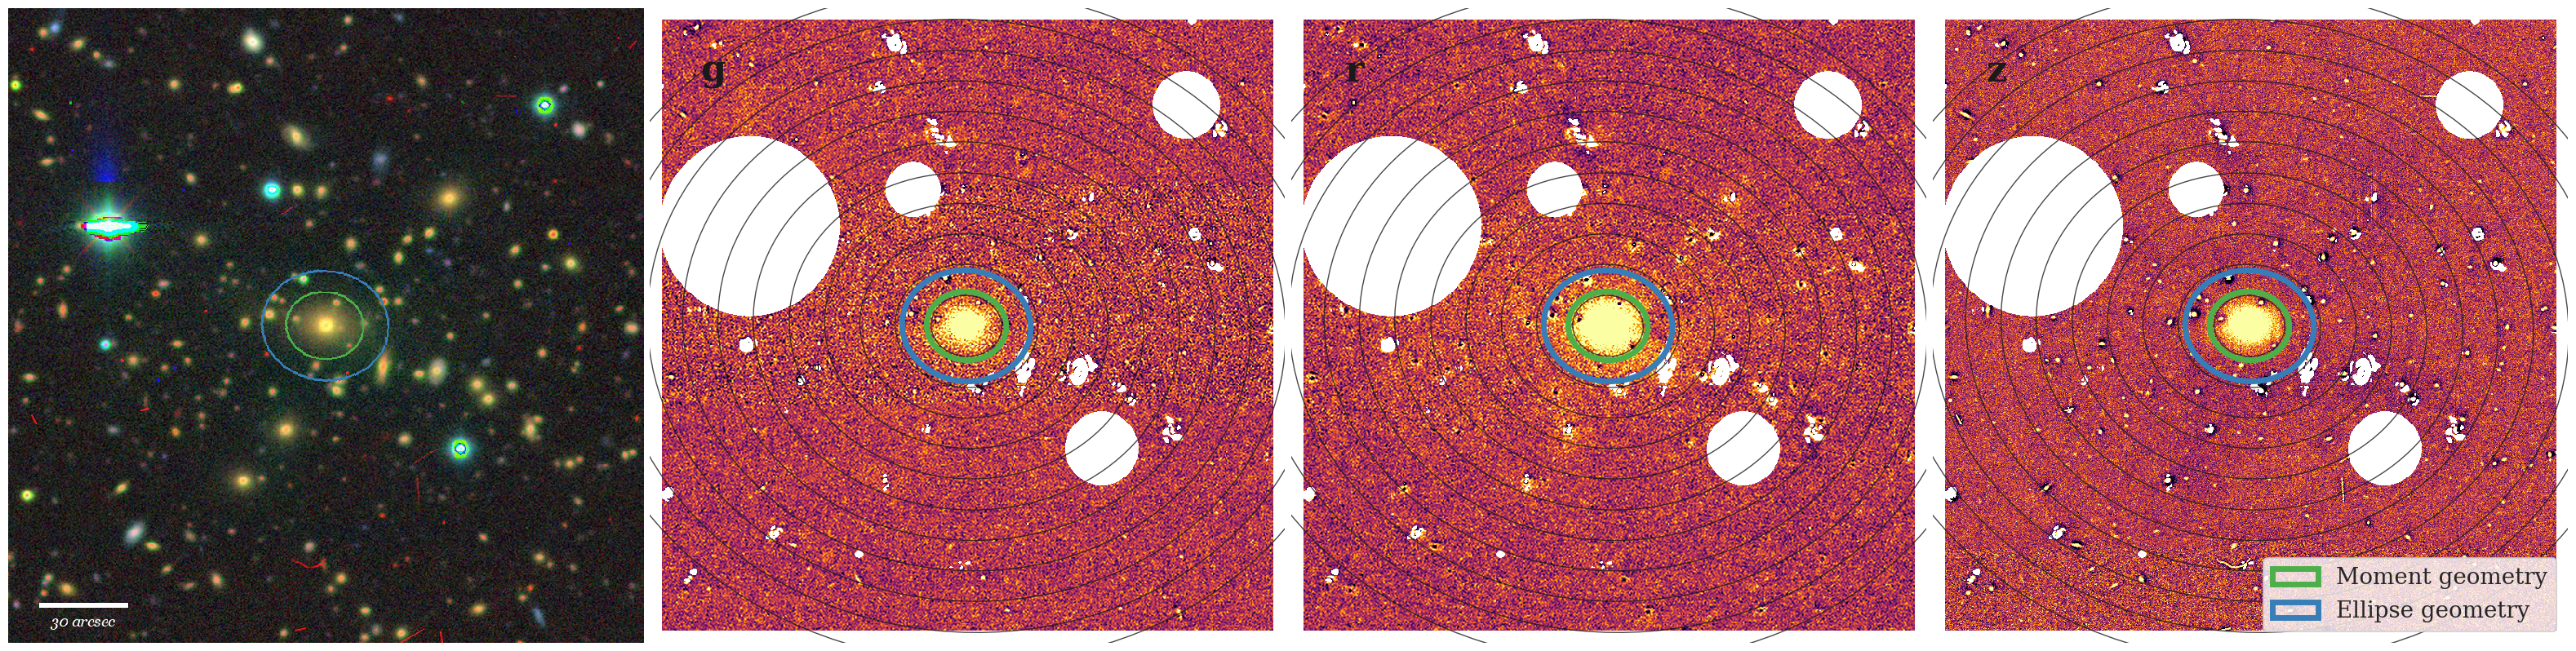
Left panel: color mosaic with the original and final ellipse geometry shown. Middle panel: original maskbits image based on the Hyperleda geometry. Right panel: distribution of all sources and frozen sources (the size of the orange square markers is proportional to the r-band flux).
 |
 |