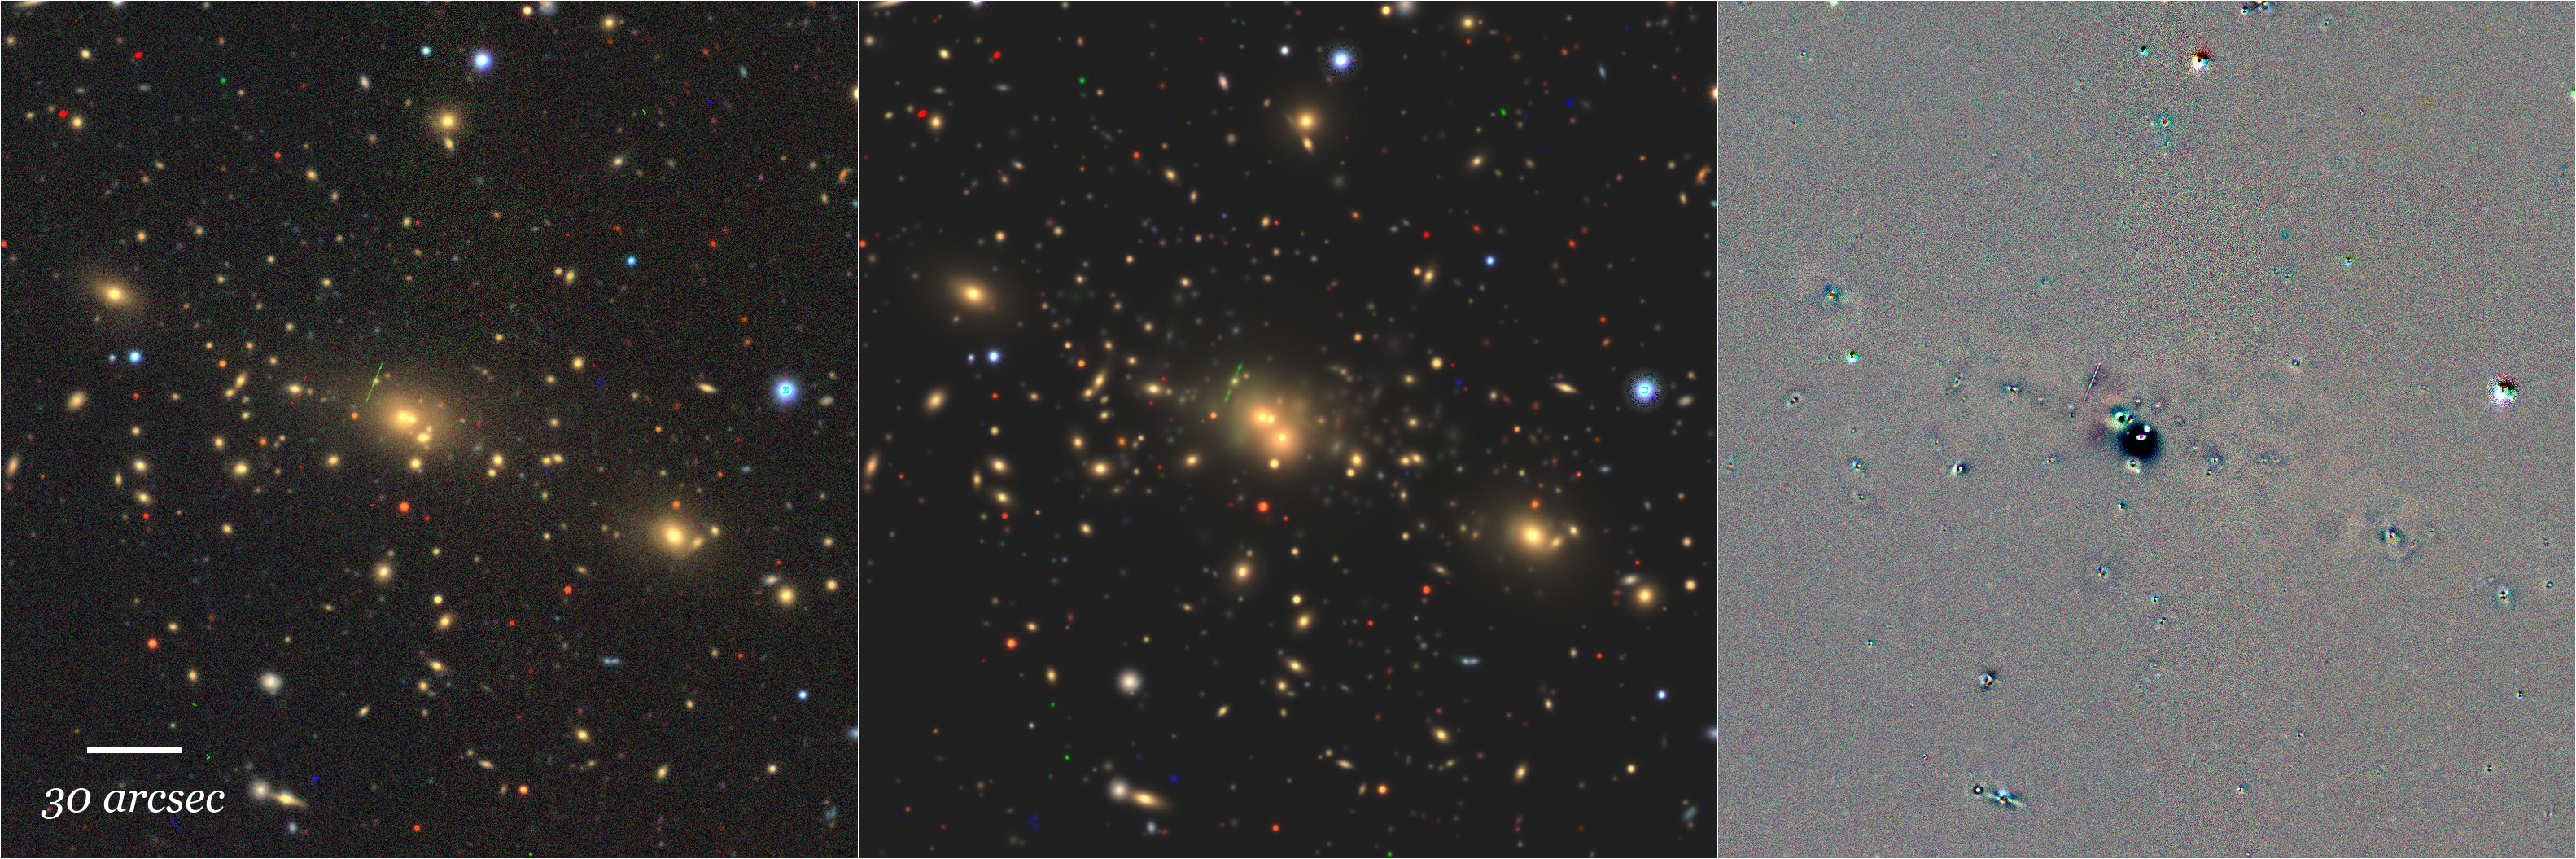
Color mosaics showing the data (left panel), model (middle panel), and residuals (right panel).
|
Tractor catalog not available.
Left panel: color mosaic with the original and final ellipse geometry shown. Middle panel: original maskbits image based on the Hyperleda geometry. Right panel: distribution of all sources and frozen sources (the size of the orange square markers is proportional to the r-band flux).
 |
 |