climatologyMapSoseVelMag
An analysis task for comparing velocity magnitude at various depths against results from the Southern Ocean State Estimate (SOSE).
Component and Tags:
component: ocean
tags: climatology, horizontalMap, sose, velocity, magnitude
Configuration Options
The following configuration options are available for this task:
[climatologyMapSoseVelMag]
## options related to plotting climatology maps of Antarctic
## meridional against reference model results and SOSE reanalysis data

# comparison grid(s)
# only the Antarctic really makes sense but lat-lon could technically work.
comparisonGrids = ['antarctic']

# Months or seasons to plot (Jan, Feb, Mar, Apr, May, Jun, Jul, Aug, Sep, Oct,
# Nov, Dec, JFM, AMJ, JAS, OND, ANN)
seasons =  ['ANN','JFM','JAS']

# list of depths in meters (positive up) at which to analyze, 'top' for the
# sea surface, 'bot' for the sea floor
depths = ['top', -200, -400, -600, -800, 'bot']

# colormap for model/observations
colormapNameResult = ice
# color indices into colormapName for filled contours
# the type of norm used in the colormap
normTypeResult = linear
# A dictionary with keywords for the SemiLogNorm
normArgsResult = {'vmin': 0, 'vmax': 0.2}
# determine the ticks automatically by default, uncomment to specify
# colorbarTicksResult = numpy.linspace(0, 0.2, 9)

# colormap for differences
colormapNameDifference = balance
# the type of norm used in the colormap
normTypeDifference = linear
# A dictionary with keywords for the SemiLogNorm
normArgsDifference = {'vmin': -0.2, 'vmax': 0.2}
# determine the ticks automatically by default, uncomment to specify
# colorbarTicksDifference = numpy.linspace(-0.2, 0.2, 9)
- For more details, see:
The option depths is a list of (approximate) depths at which to sample
the velocity magnitude field. A value of 'top' indicates the sea
surface (or the ice-ocean interface under ice shelves) while a value of
'bot' indicates the seafloor.
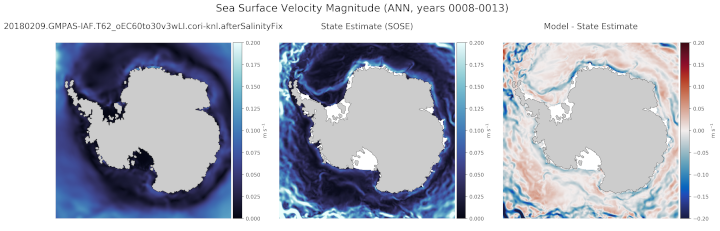
State Estimate
Example Result