timeSeriesSeaIceAreaVol
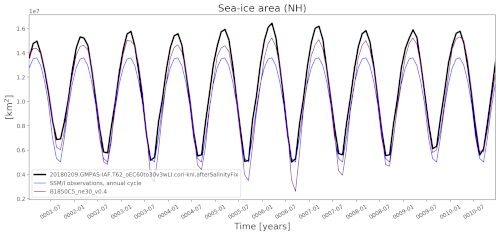
An analysis task for plotting time series of sea ice area and volume for both the Arctic and Antarctic against observations.
Component and Tags:
component: seaIce
tags: timeSeries, publicObs
Configuration Options
The following configuration options are available for this task:
[timeSeriesSeaIceAreaVol]
## options related to plotting time series of sea ice area and volume

# compare to observations?
compareWithObservations = True
# Number of points over which to compute moving average (e.g., for monthly
# output, movingAveragePoints=12 corresponds to a 12-month moving average
# window)
movingAveragePoints = 1
# title font properties
titleFontSize = 18
# plot on polar plot
polarPlot = False

# An optional first year for the tick marks on the x axis. Leare commented out
# to start at the beginning of the time series.

# firstYearXTicks = 1

# An optional number of years between tick marks on the x axis.  Leave
# commented out to determine the distance between ticks automatically.

# yearStrideXTicks = 1
compareWithObservations can be set to False to disable comparison with
both sets of observations (see below).
The title font size can be customized with titleFontSize, given in points.
To produce ploar plots (with time progressing clockwise around the origin and
sea ice area or volume the distance from the origin) in addition to the
typical time series with time on the x axis, set polarPlot = True.
- For details on the remaining config options, see:
Observations
Example Result