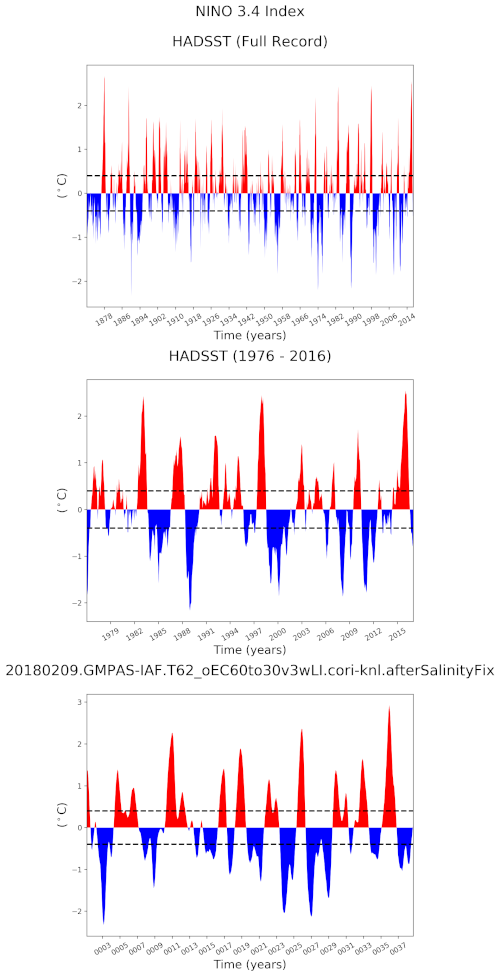
indexNino34
An analysis task for plotting both time series and spectra of the El Niño 3.4 Climate Index against observations.
Component and Tags:
component: ocean
tags: timeSeries, index, nino, publicObs
Configuration Options
The following configuration options are available for this task:
[indexNino34]
## options related to plotting time series of the El Nino 3.4 index

# Specified region for the Nino Index,'nino3', 'nino4', or 'nino3.4'
# The indexNino34 routine only accepts one value at a time
region = nino3.4

# Data source to read for comparison.  There are two options
# 1 - ERS SSTv4 -- Extended Reconstructed Sea Surface Temperature -- 1854 - 2016
# 2 - HADIsst -- Hadley Center analysis -- 1870 - 2016
observationData = HADIsst
While the default is the El Niño 3.4 region, you may select among
nino3, nino4, and nino3.4. See Regions for more
information about regions in MPAS-Analyis.
Note
A bug in indexNino34 means that plot titles and other output will
indicate that El Niño 3.4 was plotted regarless of which of the three
El Niño regions was actually selected.
By default, observations are taken from the Hadley Center analysis. To use
the Extended Reconstructed Sea Surface Temperature (ERS SSTv4), set
observationData = ERS SSTv4.
Observations
Example Result